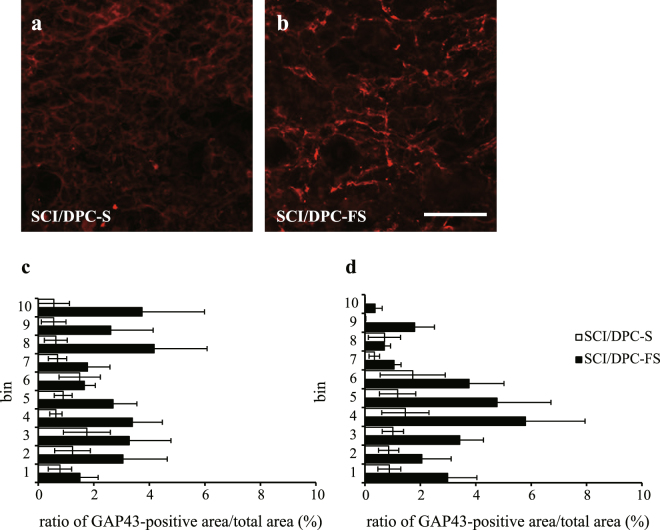
Figure 3.
Distribution and quantification of GAP-43–positive area in the spinal cord at 1 week after SCI and DPC transplantation. Fluorescence photomicrographs were GAP-43–immunostained sagittal sections of the spinal cords at 1 mm caudal to the lesion site of the SCI rats at 1 week after transplantation of DPC-S (a) and DPC-FS (b), respectively. Percentages of GAP-43–positive area against total area were evaluated and the values were expressed as means ± SE (c, rostral and d, caudal). The ratio of GAP-43–positive area/total area were significantly larger in the SCI/DPC-FS than those in the SCI/DPC-S group (2.8 ± 0.5 vs 1.0 ± 0.4, for rostral, and 2.9 ± 0.7 vs 1.2 ± 0.5 for caudal; p < 0.05, and p < 0.05, respectively, Student’s t-test, n = 6 for SCI/DPC-S, and n = 9 for SCI/DPC-FS group, respectively). Scale bar 100 μm.

