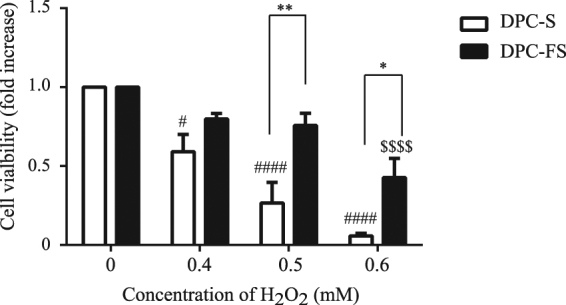
Figure 5.

Effect of FGF2 priming on H2O2-induced DPC death. DPC-S and DPC-FS were exposed to H2O2 at various concentrations (0, 0.4, 0.5, and 0.6 mM) for 24 hr, followed by MTT assay. The ratios of the absorbance values for the DPCs exposed to H2O2 were calculated relative to the control (H2O2-untreated DPCs). The values are expressed as the mean ± SE. Significant differences between the two groups were determined by two-way ANOVA post hoc with Tukey’s multiple comparison test. *p < 0.05, **p < 0.01 vs DPC-S treated with H2O2 at the same concentration; #p < 0.05, ###p < 0.001 vs DPC-S untreated with H2O2; and $$$p < 0.001 vs DPC-FS untreated with H2O2, respectively; n = 5.
