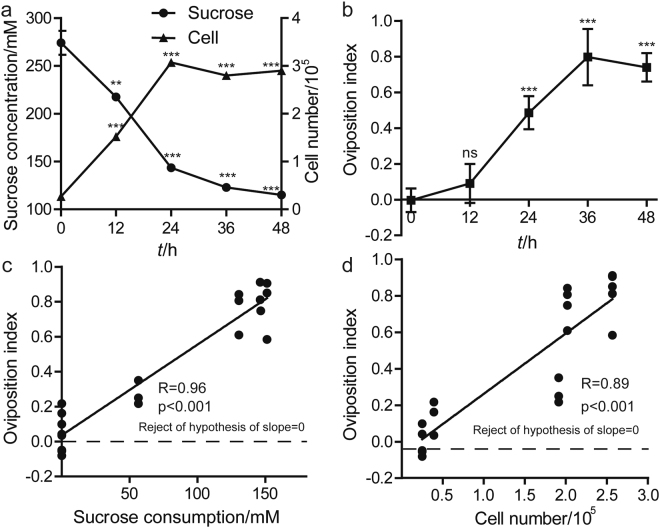
Figure 4.
Drosophila preference for fermentation correlated with sucrose consumption and bacterial population. (a) The concentration of sucrose and viable bacterial cells in fly food. The concentrations of sucrose reduced over time, while bacterial density increased. n = 12, one of three replicates. (b) Drosophila temporal oviposition preference for fermentation. n = 16, one of three replicates. (c,d) The relationship between sucrose consumption, bacterial density and Drosophila oviposition preference for fermentation. A linear standard curve with an unconstrained slope was generated and compared to a null model with slope = 0. Each data point represents sucrose concentration or viable cell number of fly food along with the mean oviposition index value toward fermentation. A semilog standard curve with an unconstrained slope was generated and compared to a null model with slope = 0. The data fit to an unconstrained slope better than to the null model (For sucrose consumption: p < 0.0001, slope = −0.95; for bacterial density: p < 0.0001, slope = −0.95). ANOVA tests with LSD post hoc analysis. Mean ± SEM. Symbols: NS p > 0.05; **p < 0.01; ***p < 0.001.

