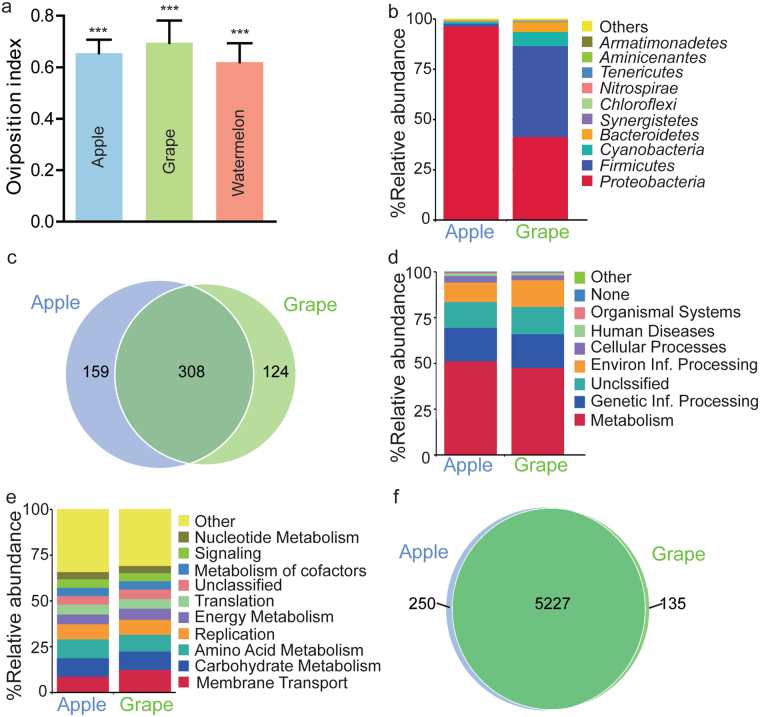
Figure 5.
The composition and function of rotting fruit-associated microbiota. (a) Two-choice oviposition assay for fruit purée. Fruit purée (20%w/v) replaced sucrose in the behavior-testing media, and oviposition preference was assayed between fresh and fermented choices. The one-sample t-test was used to assess the mean deviance of each column from 0. n = 4. (b) Composition and distribution of the dominant bacterial taxa within rotting apples and grapes. (c) Venn diagram showing the presence of bacterial taxa within two fruits. The number of bacteria in rotting apples and grapes was in the circles. (d,e) PICRUSt predicted microbiota function based on inferred metagenomes of rotting fruit-associated bacteria at the primary (d) and upper (e) level using the PICRUSt algorithm. (f) Venn diagram showing the distribution of predicted KEGG genes within two fruit samples. The one-sample t-test, Mean ± SEM, Symbols: ***p < 0.001.

