Figure 4.
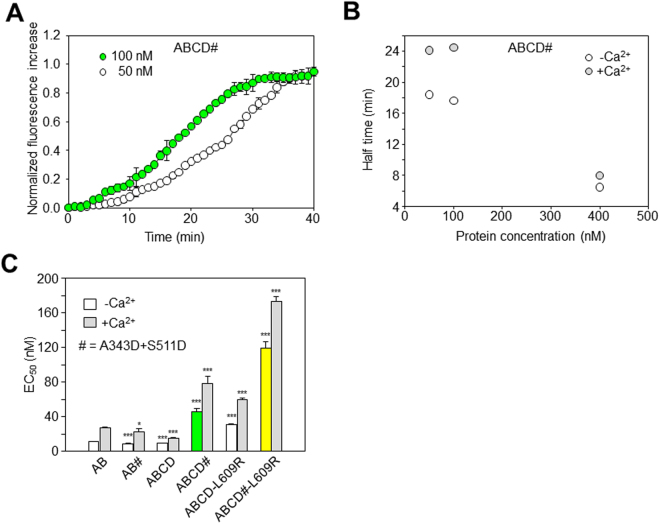
Acquisition of the trans-binding mode depends on the protein concentration and calcium levels. (A) Time course of the increase in D-CaM fluorescence obtained upon binding to ABCD# (50 or 100 nM). Each trace represents the average of 3 experiments. (B) Relationship between the time to reach the half-maximal increase in D-CaM fluorescence and protein concentration in the presence (gray circles) and absence of Ca2+ (white circles). (C) Plot of the apparent binding affinity (EC50) obtained from the concentration-response curves as in Fig. 1B (D-CaM 12.5 nM). The apparent binding affinity was derived from 3 or more experiments. The experiments were performed both in the presence (gray bars) and absence of Ca2+ (white, yellow and green columns). The asterisks indicate significantly different values versus AB: *p < 0.05; ***p < 0.001.

