
Figure 2.
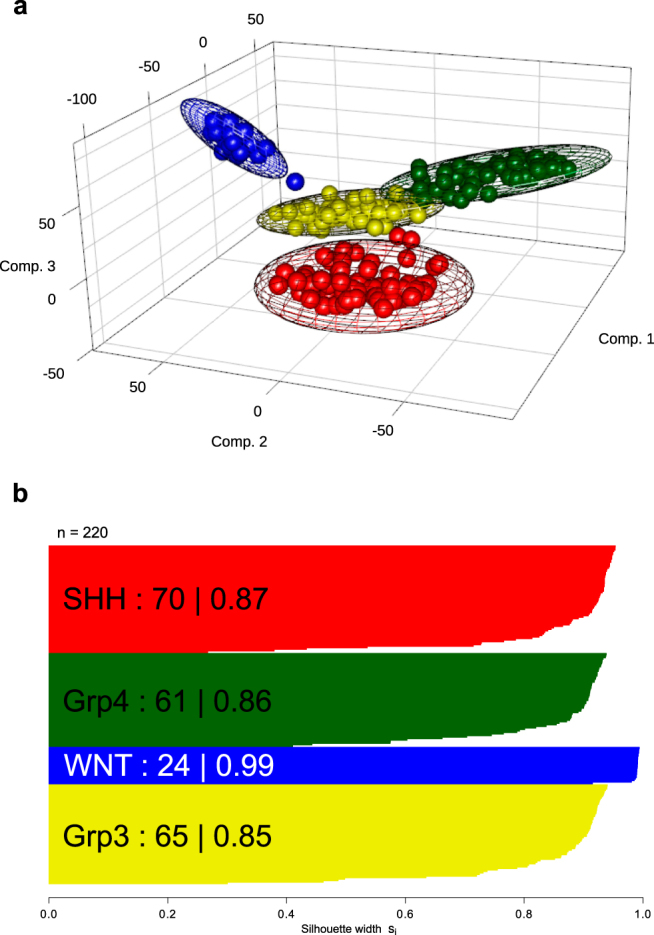
Derivation of the four consensus medulloblastoma molecular subgroups in a training cohort (n = 220) using genome-wide Illumina 450k DNA methylation microarray data. (a) Principal Component Analysis (PCA) visualization of groups identified using consensus NMF clustering. Subgroup members are shown in their consensus colours (blue (WNT); red (SHH); yellow (Grp3) and green (Grp4)). Covariance spheroids were plotted at 95% confidence intervals. (b) Silhouette plot demonstrates robustness of each group (number and average silhouette width are shown).