Figure 5.
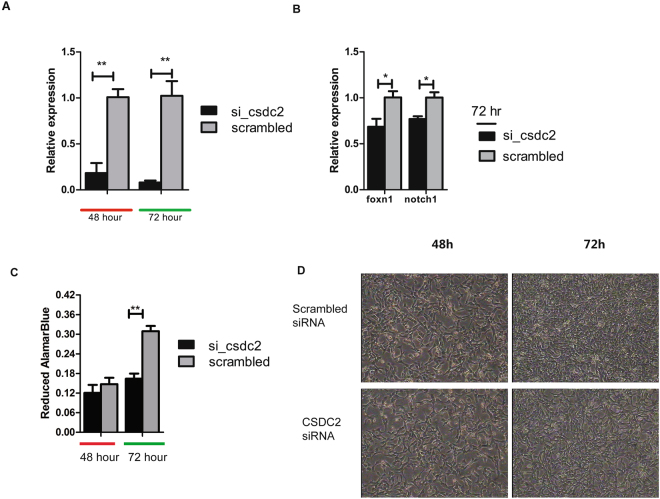
RNAi-mediated CSDC2 silencing in NIH/3T3 cells. (A) qPCR analysis of CSDC2 in NIH/3T3 cells that were transfected with control (scrambled) or si-CSDC2. N = 3; P values were calculated using Student’s t test. Error bars indicate SEM. (B) Quantitation of gene expression related to hair-follicle development by qPCR in NIH/3T3 cells at 72 h after transfection with control (scrambled) or si-CSDC2. N = 3; P values were calculated using Student’s t test. Error bars indicate SEM. (C) Cell proliferation at 48 h and 72 h after silencing. (D) Growth of NIH/3T3 cells at 48 h and 72 h after transfection; the images were taken at 40x magnification.

