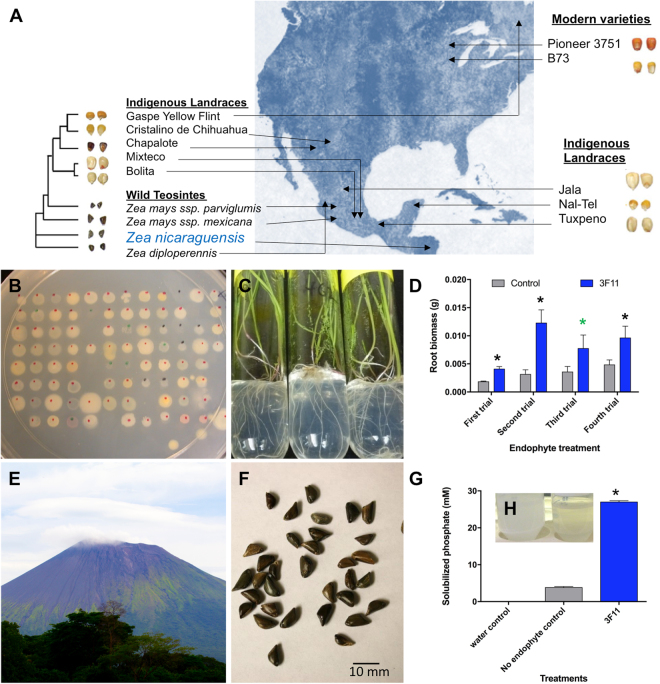
Figure 1.
Testing bacterial endophytes from seeds of diverse wild, ancient and modern genotypes of corn (genus Zea) for growth promotion of P-hyperaccumulating annual ryegrass. (A) Geographic origin of Zea seeds used as sources of endophytes in this study. The map image was modified from a photo created by Nicolas Raymond, available at https://www.flickr.com/photos/80497449@N04/10012162166/ and licensed under the Creative Commons Attribution 2.0 Generic (CC BY 2.0, https://creativecommons.org/licenses/by/2.0/) and available at http://freestock.ca/flags_maps_g80-world_map__abstract_acrylic_p2970.html and released under a standard Creative Commons License - Attribution 3.0 Unported, https://creativecommons.org/licenses/by/3.0/deed.en_US). (B) Colonies of bacterial endophytes on R2A agar. (C) Annual ryegrass plants from 3F11 coated seeds grown on rock P containing medium as the sole P source. (D) Root biomass after 4–5 weeks of growth. Shown are 4 independent trials (n = 3 plants for trial 1; n = 7 for trial 2; n = 15 for trials 3 and 4). The black asterisk indicates that the mean is significantly different at p = 0.05 from the control (No endophyte treatment). The green asterisk indicates significance at p = 0.1. (E) San Cristobal volcano (the geographic origin of Zea nicaraguensis, the host from which endophyte 3F11 was isolated). The volcano image was modified from a photo created by Jorge Mejia Peralta, available at https://www.flickr.com/photos/mejiaperalta/9345658009/in/photostream/ and attributed to Creative Commons Attribution 2.0 Generic (CC BY 2.0, https://creativecommons.org/licenses/by/2.0/). (F) Seeds of Zea nicaraguensis. Scale bar is 10 mm. (G,H). Testing for P solubilization by endophyte 3F11 in vitro. (G) Graph showing the concentration of solubilized P. (H) Tubes of NBRIP liquid medium containing insoluble P, either (left) uninoculated or (right) 9 days after inoculation with 3F11 showing clearing. The histograms represent the mean, and the error bars represent the standard error of the mean (SEM).

