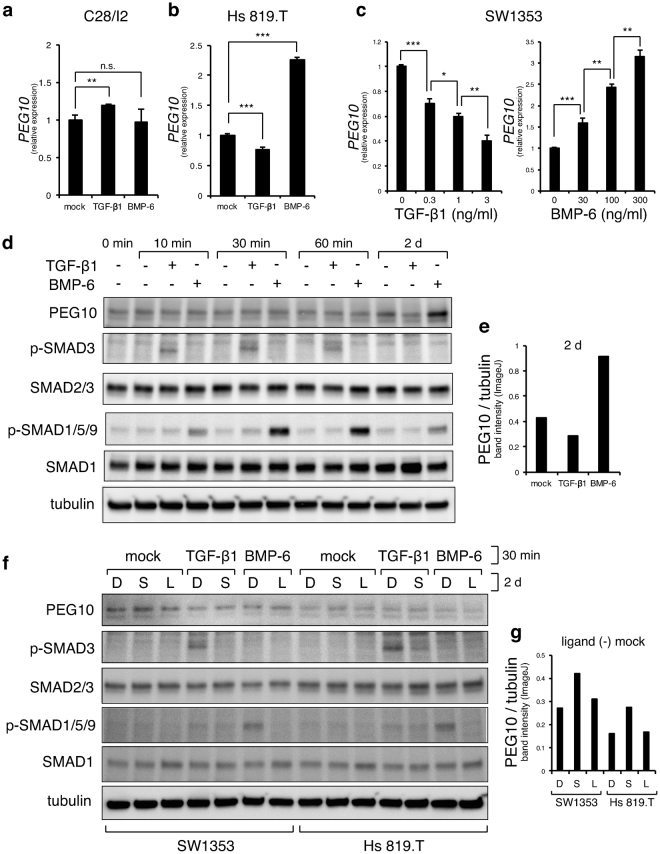
Figure 4.
PEG10 is negatively regulated by TGF-β signalling. (a) Expression of PEG10 in C28/I2 cells was examined by RT-qPCR at 2 days after application of TGF-β1 (1 ng/ml) or BMP-6 (100 ng/ml) (n = 3). (b) Expression of PEG10 in Hs 819.T cells was examined by RT-qPCR at 7 days after application of TGF-β1 (1 ng/ml) or BMP-6 (100 ng/ml) (n = 3). (c) Expression of PEG10 in SW1353 cells was examined by RT-qPCR at 2 days after application of TGF-β1 or BMP-6 at the indicated concentrations (n = 3). *P < 0.05; **P < 0.01; ***P < 0.001 (c,d); n.s., not significant. (d) Expression of PEG10 protein in SW1353 cells was examined by immunoblotting at the indicated time points after application of TGF-β1 (1 ng/ml) or BMP-6 (100 ng/ml). Blots were cropped and the full-length blots are presented in Supplementary Figure S5. Band intensities of PEG10 and tubulin at 2 days (lanes 11–13) were quantified using ImageJ software (e). The intensity of PEG10 was normalised to that of tubulin. (f,g) Chondrosarcoma cell lines were treated with DMSO (D, 0.01%), SB431542 (S, 1 μM), or LDN193189 (L, 0.1 μM) in serum-free medium containing ITS supplement overnight, followed by addition of TGF-β1 (1 ng/ml) or BMP-6 (100 ng/ml) for 30 min and were then immunoblotted using the indicated antibodies. Tubulin served as a loading control. Blots were cropped and the full-length blots are presented in Supplementary Figure S5. Bands intensities of PEG10 and tubulin (lanes 1–3 and 8–10) were quantified using ImageJ software (g). The band intensity of PEG10 was normalised to that of tubulin.

