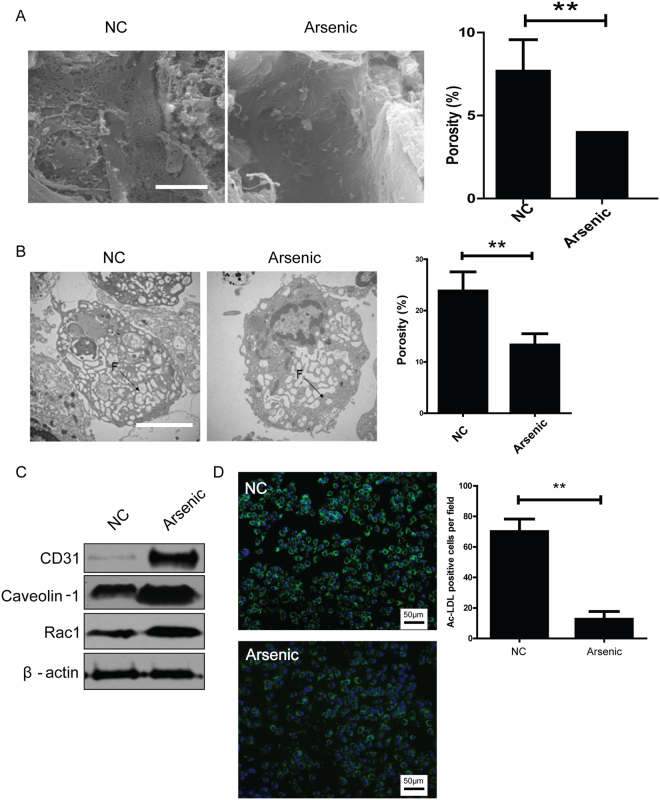
Figure 1.
NaAsO2-induced LSEC dedifferentiation. (A) Representative SEM images of liver sinusoids (n = 5) and quantitative porosity of sinusoidal fenestrae in normal and NaAsO2-induced groups. Bar = 1μm. **P < 0.01. (B) Representative TEM images of primary LSECs isolated from normal (n = 5) and NaAsO2-induced group (n = 5) and quantitative porosity of sinusoidal fenestrae. Bar = 1μm. **P < 0.01. (C) The expressions of CD31, Caveoloin-1 and Rac1 in normal and NaAsO2-induced groups were analyzed by western blot. All western blot experiments were repeated at least three times. Full-length blots are included in Supplemental Information. (D) Uptake of Ac-LDL was analyzed by fluorescence microscopy in primary LSECs isolated from normal and NaAsO2-induced groups and cultured overnight. All experiments in (C) and (D) were repeated at least three times.

