Figure 6.
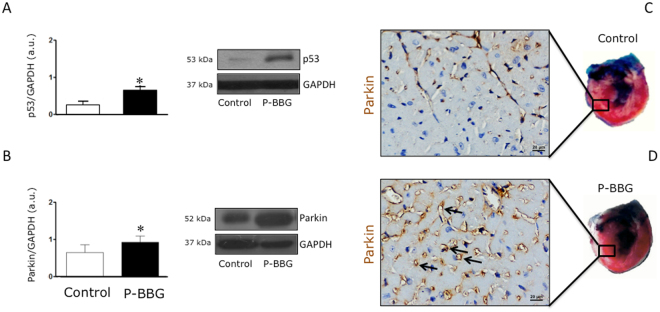
Effects of P-BBG diet on levels of myocardial p53 and Parkin. (A) P-BBG diet (n = 7) increased the myocardial protein levels of p53 compared to Control (n = 7) diet. Levels of p53 are expressed as arbitrary units of p53 (53 kDa, MW)/GAPDH (37 kDa, MW) ratio. Representative images of cropped densitometric bands of p53 and GAPDH are shown. The full-length blots/gels are presented in Supplementary Figure 1F. (B) P-BBG diet (n = 7) increased the myocardial protein levels of Parkin compared to Control diet (n = 7). Levels of Parkin are expressed as arbitrary units of Parkin (52 kDa, MW)/GAPDH (37 kDa, MW) ratio. Representative images of cropped densitometric bands of Parkin and GAPDH are shown. The full-length blots/gels are presented in Supplementary Figure 1G. (C) Representative images of Parkin localization in coronary endothelium of Control left ventricles. (D) Representative images of Parkin localization in coronary endothelium of P-BBG left ventricles. P-BBG: low fat diet supplemented with barley beta-D-glucan enriched pasta (3 g/100 g of dry weight); GAPDH: glyceraldehyde 3-phosphate dehydrogenase. All measurements are mean ± SD. *p < 0.05 vs. Control.

