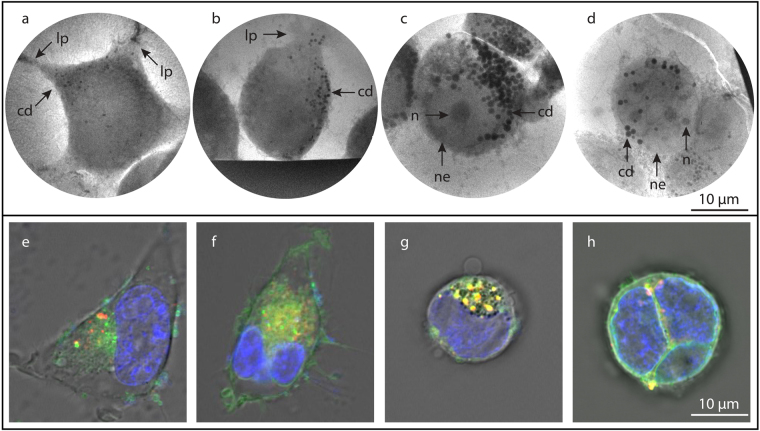
Figure 2.
HEK293T cells in different stages of starvation. (a–d) Laboratory x-ray absorption microscopy of HEK cells with increasing starvation. (a) Slightly starved cell with lamellipodia (lp) spread across the carbon grid and few and small (0.37 µm diam) carbon-dense vesicles (cd). (b) Early-stage starvation results in rounding of cell shape, decreasing adhesion and lamellipodia, and growth in number of carbon-dense vesicles. (c) Increasing starvation results in strong increase in number as well as diameter (0.88 µm diam) of carbon-dense vesicles. (d) A highly starved HEK 293 T cell showing a few nuclear envelopes (ne), nucleoli (n), and large carbon-dense vesicles. (e–h) Confocal imaging of HEK293T cells at approximately same stages of starvation, for comparison. Here the cells have been stained for nucleus (blue), membranes (green) and acidic organelles (red).The fluorescent images are overlaid on the grey DIC image. Scale bars 10 µm.

