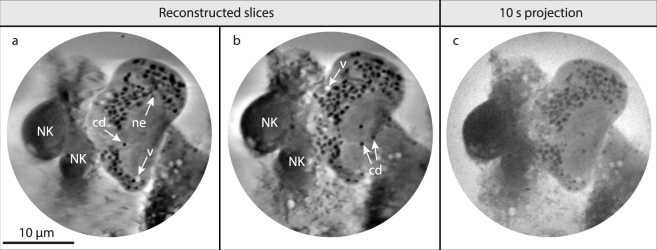
Figure 5.
3D tomographic reconstruction of NK cell interaction with starving HEK293T cell. (a,b) Two slices from the reconstructed 3D volume of two NK cells interacting with a starved HEK293T cell. Vacuoles (v), nuclear envelope (ne), and carbon-dense vesicles (cd) are marked. The full volume and a segmentation are provided in Supplementary Material. (c) One of the 2D 10-second projections used for the tomography, for comparison. Scale bar 10 µm.

