Figure 5.
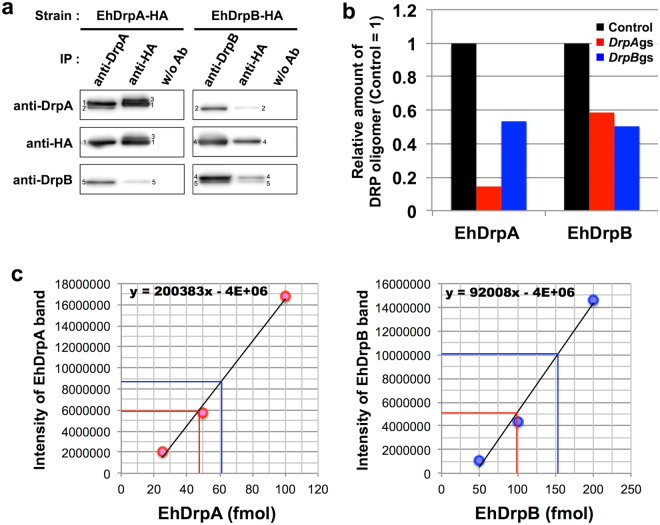
Analyses of EhDrpA-EhDrpB interaction. (a) Immunoprecipitation and immunoblot analysis of EhDRPs. EhDrpA and EhDrpB were immunoprecipitated from whole cell lysates (1 mg protein) of EhDrpA-HA and EhDrpB-HA strains using anti-DrpA, anti-DrpB, and anti-HA antibodies. Immunoprecipitation was also carried out without antibody (“w/o Ab”). Immunoprecipitated proteins were subjected to SDS-PAGE (about 150 µg protein per lane). Antibodies used for immunoprecipitation (IP) and immunoblots are indicated. Individual bands are labeled as follows: 1, EhDrpA-HA; 2, endogenous EhDrpA; 3, post-translationally modified EhDrpA-HA; 4, EhDrpB-HA; 5, endogenous EhDrpB. Original and unclipped immunoblots are shown in Supplementary Fig. S10. (b) Relative amounts of EhDrpA and EhDrpB in the 900-kDa EhDRP complex of DrpAgs, DrpBgs, and control strains. DrpAgs (red bars), DrpBgs (blue bars), and control (black bars) denote the strains in which EhDrpA or EhDrpB gene was silenced, and control strain, respectively. The intensities of the bands in the immunoblots (Supplementary Fig. S11) were measured and shown relative to the control. (c) A standard curve for the quantification of EhDrpA and EhDrpB in the hetero-oligomer. EhDRP was immunoprecipitated from trophozoites of E. histolytica HM-1:IMSS cl6 wild type by anti-DrpA or anti-DrpB antibodies. Shown on the horizontal axis are the amounts of each EhDRP (in fmol). On the vertical axis, the intensity of EhDrpA and EhDrpB bands in the immunoblots are shown respectively (see also Supplementary Fig. S12). Circles indicate the recombinant histidine-tagged (His6)-EhDRP-HA proteins of various known amounts used as standards, and measured for band intensities in immunoblots using specific antibodies against EhDRPs. Standard curves were created by linear regression. Red and blue lines indicate the intensities of the detected EhDrpA and EhDrpB bands in immunoblots of the immunoprecipitated samples by anti-DrpA and anti-DrpB antibodies, and the estimated amount of EhDrpA and EhDrpB, respectively.

