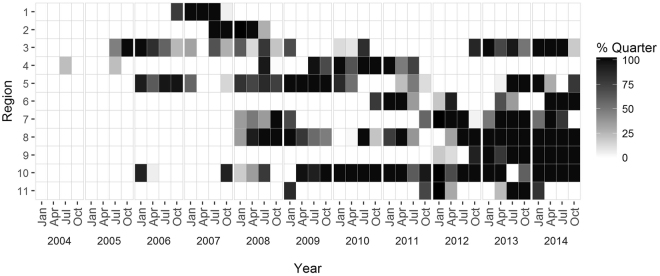
Figure 5.
Recording Effort: Figure indicating the proportion of year with available passive acoustic recordings in each region (see Fig. 1). Years are split into quarters from January 2004 to December 2014. Black indicates at least one recorder present for the entire quarter year for that region, lighter gray indicates a portion of that time period with recordings, and white indicates no available acoustic data for that region and time period.

