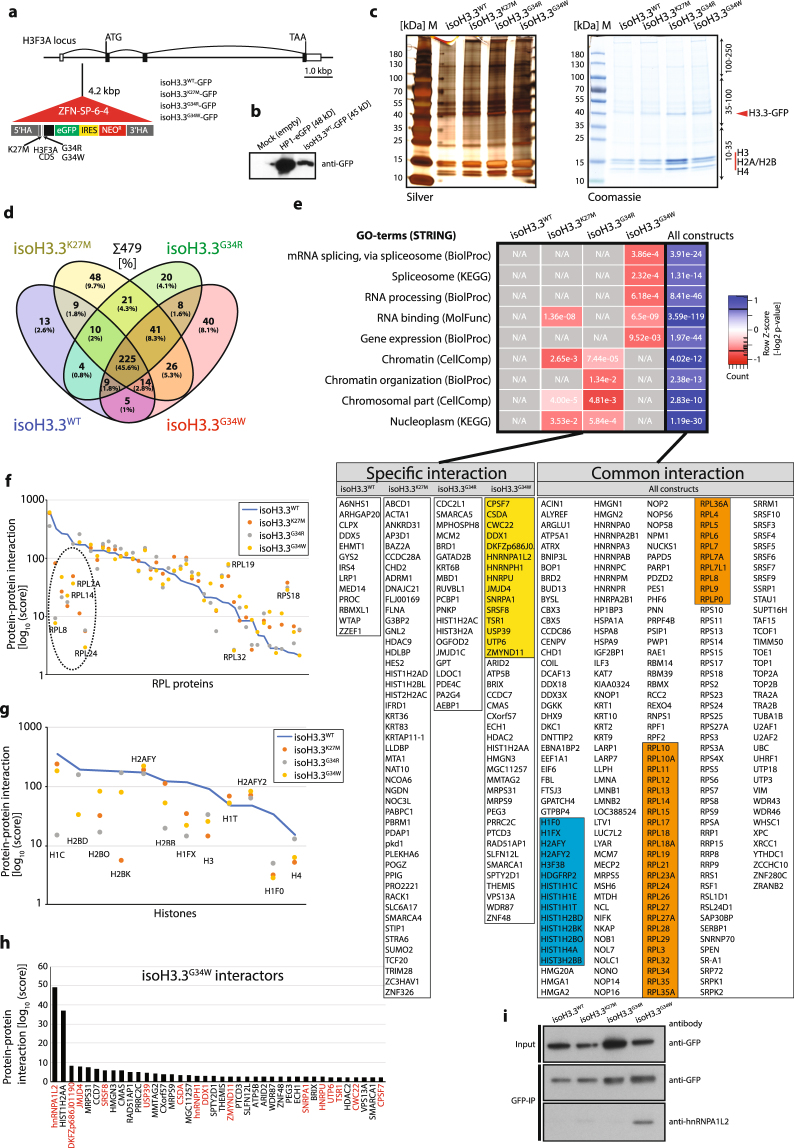
Figure 3.
Immunoprecipitations coupled to mass spectrometry analysis of mutated and unmutated H3.3 reveal novel and common interacting proteins. (a) Illustration of H3.3 constructs targeting intron 1 of the endogenous H3F3A locus. The H3F3A CDS was fused to eGFP (with stop codon) and an IRES-separated Neo for antibiotic resistance. The IRES between GFP and Neo facilitates production of separate transcripts. The construct is driven by the endogenous H3F3A promoter (exon 1) and the downstream endogenous exon 2, 3 and 4 does not contain any mutations and is not translated. (b) Western blot verification of the H3.3WT construct for GFP expression. Heterochromatin Protein1 (HP1)-GFP was used as positive control and mock empty vector as negative control. (c) PAGE-gel of immunoprecipitated protein lysates by anti-GFP antibody of the isogenic cell lines. The gels were stained with silver (left panel) and Coomassie (right panel). Each lane was divided into three equal slices before in-gel digestion and LC-MS/MS mass spectrometry analysis. The H3.3-GFP band is indicated, and associated histones. (d) Venn diagram indicating relationship between constructs and immunoprecipitated proteins, identified by LC-MS/MS. Numbers are individual proteins and in parentheses percentage of total. (e) GO-term analysis of interacting proteins using the STRING application (string-db.org). Heatmap of GO-terms based on z-score transformed [−log2] P-values. Individual proteins identified are listed below the heatmap, divided in columns. Colored boxes represent spliceosome-associated proteins (yellow), RPL proteins (orange) and histones (blue). Common interactions are proteins bound to all isoH3.3-lines. (f) RPL protein family members plotted as a function of protein-protein interaction [log10 score]. Dashed line circle indicates RPL proteins with highest scores in unmutated construct (blue line) with the biggest drop of scores. (g) Histones, especially H1 and H2B, show reduced protein-protein interaction score as compared to unmutated construct (blue line). (h) Bar graph with the H3.3G34W-interacting proteins, indicating hnRNPA1L2 with the highest score. Protein names in red indicate splicing-associated factors. (i) Western blot analysis of GFP-immunoprecipitations from total protein extracts of the isoH3.3 lines. Input indicates H3.3-GFP in total protein extracts and Co-IP the amount of H3.3-GFP precipitated after GFP-bead binding and elusion. The same filter as GFP-IP was used to detect hnRNPA1L2.

