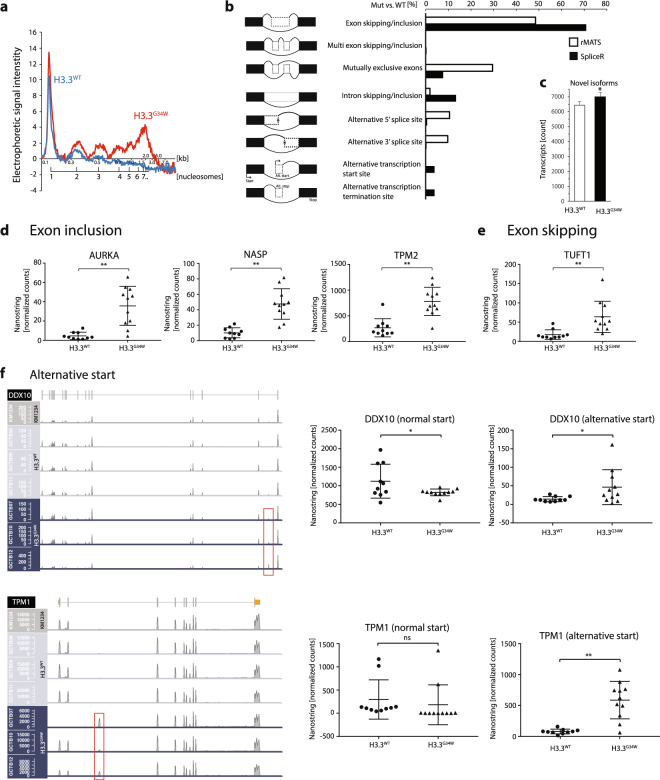
Figure 4.
RNA-sequencing analysis of three H3.3WT and three H3.3G34W primary cell lines show distinct splicing aberrations. (a) Electropherogram of MNase assay estimating chromatin compaction of mutated and unmutated primary cells. Plot based on 60 min incubation with MNase of H3.3WT (blue line) and H3.3G34W (red line) primary cell lines and BioAnalyzer data collection. (b) RNA splicing events of H3.3G34W vs. H3.3WT primary cells, extracted by the rMATS and SpliceR algorithms. The increased splicing events in H3.3G34W when compared to H3.3WT are given in [%]. (c) Plot of the significant increase of potentially novel isoforms. The data is based on the Cufflinks category j that calls for potentially novel isoforms (fragments) with at least one splice junction shared with a reference transcript. (d) Three examples (AURKA, NASP, and TPM2) of exon inclusion events in H3.3G34W, first observed in RNA-seq. and here validated with the nCounter RNA-based hybridization technology. (e) Exon skipping in TUFT1 occur in H3.3G34W, and probe detects junction of flanking exons to the skipped exon. (f) Alternative transcriptional start sites at the DDX10 and TPM1 locus. Increased read counts in their first or second introns indicated by red boxes. Plot of nCounter validations are shown in the right panel, where loss of normal start correlates with gain of alternative start.

