Figure 3.
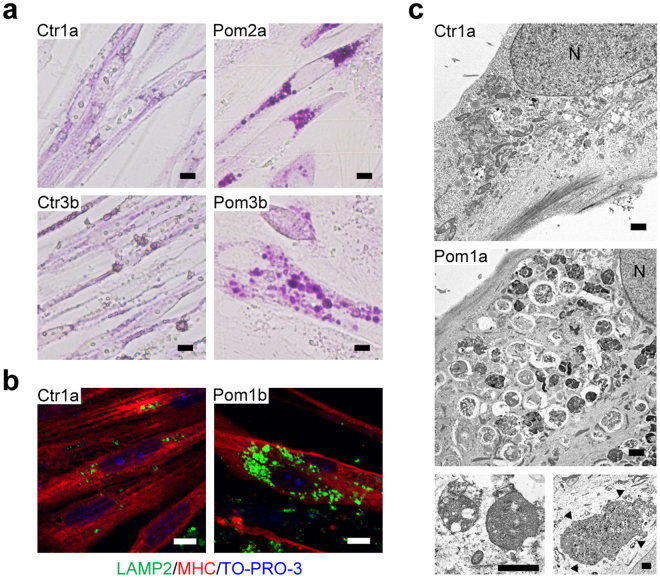
Lysosomal glycogen accumulation in Pom iPSCMyoD-derived myocytes. (a) Bright field microscopic images of PAS stain in representative Ctr and Pom iPSCMyoD-derived myocytes. Scale bar = 10 µm. (b) Confocal microscopic images of IF for LAMP2 (green) and MHC (red) in representative Ctr and Pom iPSCMyoD-derived myocytes. Nuclei were stained with TO-PRO-3. Scale bar = 10 µm. (c) Electron microscopic images in representative Ctr and Pom iPSCMyoD-derived myocytes. The most lower panels are more and less magnified images. Some Pom1a iPSCMyoD-derived myocytes contain an extremely large glycogen-filled lysosome (arrowheads). A capital letter “N” represents a nucleus. Scale bar = 1 µm.

