Figure 4.
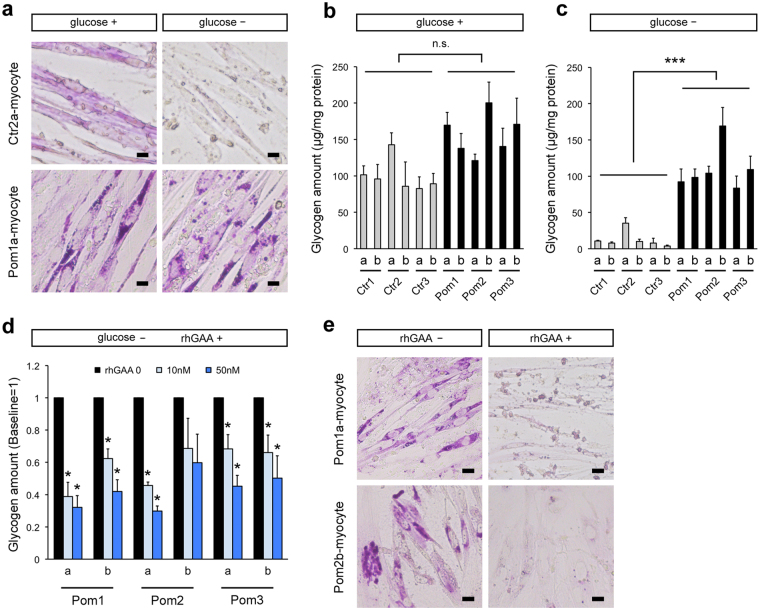
Analysis of lysosomal glycogen accumulation with transient glucose deprivation in Pom iPSCMyoD-derived myocytes. (a) Representative bright field microscopic images of PAS stain in Ctr and Pom iPSCMyoD-derived myocytes. The left row (designated as “glucose+”) shows myocytes cultured in normal glucose-containing medium. The right row (“glucose–”) shows myocytes after 24 h culture with glucose-free medium. Scale bar = 10 µm. (b) Quantitative analysis of glycogen amounts adjusted for protein amounts in iPSCMyoD-derived myocytes in normal glucose-containing medium (n = 3 experiments). (c) Quantitative analysis of glycogen amounts adjusted for protein amounts in iPSCMyoD-derived myocytes after 24 h of culture with glucose-free medium (n = 3 experiments). (d) Quantitative analysis of glycogen amounts adjusted for protein after 24 h of glucose deprivation and 3 days of treatment with rhGAA (0, 10, and 50 nM) in Pom iPSCMyoD-derived myocytes. The graph represents the relative ratio to the baseline glycogen amount (no rhGAA). Asterisks indicate a significant difference compared to the baseline (n = 3 experiments). (e) Representative bright field microscopic images of PAS stain in Pom iPSCMyoD-derived myocytes after 24 h of glucose deprivation without rhGAA treatment (left row) and with rhGAA treatment (right row). Scale bar = 20 µm.

