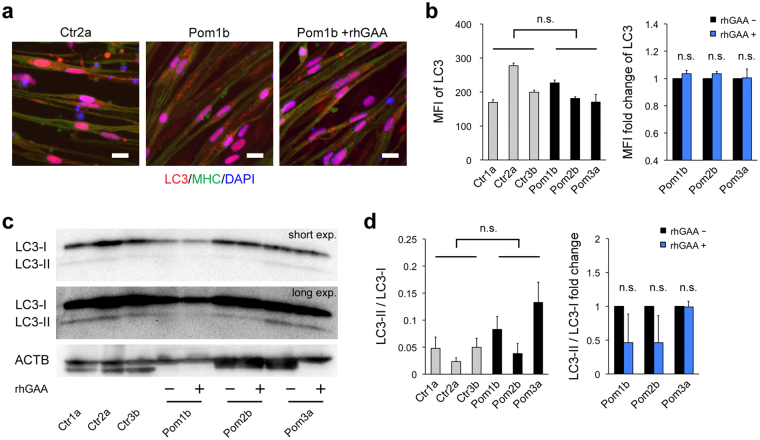
Figure 6.
No significant autophagic accumulation in Pom iPSCMyoD-derived myocytes. (a) Representative microscopic images of immunofluorescence for LC3 (red; autophagic marker) and MHC (green) in iPSCMyoD-derived myocytes. Pom iPSCMyoD-derived myocytes were cultured without or with 1 µM rhGAA for 3 days. Nuclei were stained with DAPI. Scale bar = 20 µm. (b) MFI of LC3 (integrated LC3 fluorescent signals adjusted for MHC-positive area) in iPSCMyoD-derived myocytes (left graph) and the fold change of MFI with rhGAA rescue (right) (n = 3 microscopic fields). (c) Representative blots of Western blot analysis for LC3 in protein extracts from iPSCMyoD-derived myocytes. Abbreviation: exp., exposure. (d) Quantitative densitometric analysis of western blots (n = 3 experiments). The left graph shows LC3-II/LC3-I ratio in iPSCMyoD-derived myocytes. The right graph shows fold change of LC3-II/LC3-I ratio with rhGAA rescue.

