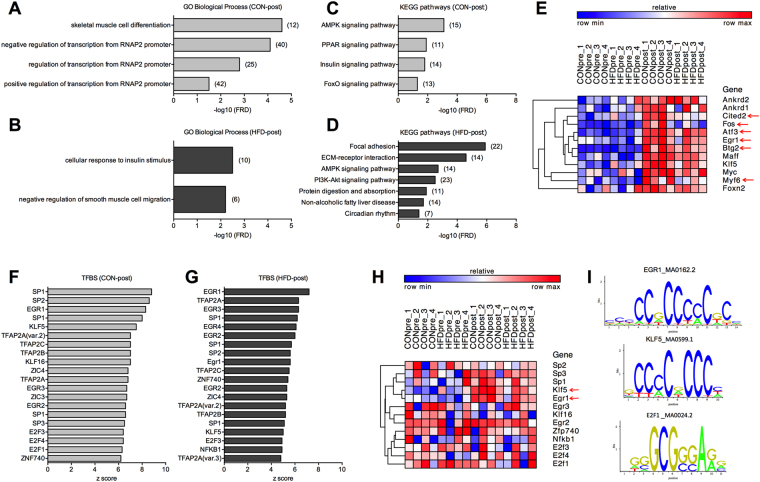
Figure 3.
Transcriptional response to acute maximal exercise in CON and HFD mice. (A and B) GO biological processes and (C and D) KEGG pathways enriched in CON-post and HFD-post DEG (number of genes is shown in brackets). (E) Heat map showing cluster analysis of DEG contained in the GO term skeletal muscle cell differentiation enriched in CON-post (red arrows show differentially expressed genes between CON-post vs. HFD-post). (F and G) Top 20 TFBS enriched in CON-post and HFD-post DEG. (H) Transcript levels of TFs associated with the top 20 TFBS in CON and HFD mice. (I) Representative TFBS logos found in CON and HFD mice. n = 4 muscles per group.

