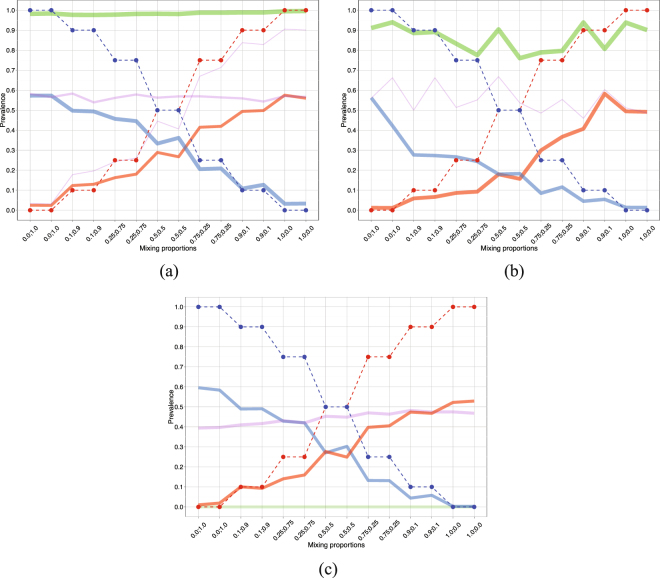
Figure 2.
Experiment 2 (aneuploid cell lines DAH55 and DAH56). Effect of using incorrect copy numbers. (a) PyClone predicted cluster prevalences assuming diploid loci. The solid lines show the PyClone predicted cluster prevalences. The red solid line corresponds to a cluster of 21 DAH55 specific SNVs, the blue solid line to 27 DAH56 specific SNVs, the green solid line to a cluster of mainly shared SNVs and the purple solid lines to two other clusters, one of size 17 and the other of size 8 (see Supplementary Table S13). The other plot components are as in Fig. 1e. (b) PyClone predicted cluster prevalences adding random noise to copy number information. The solid lines show the PyClone predicted cluster prevalences. The red solid line corresponds to a cluster of 29 DAH55 specific SNVs, the blue solid line to 27 DAH56 specific SNVs, the green solid line to a cluster of 34 mainly shared SNVs and the purple solid line to a cluster of 9 mainly shared SNVs (see Supplementary Table S14). The other plot components are as in Fig. 1e. (c) Clomial predicted clonal prevalences. The red, blue, and purple solid lines correspond to the predicted clonal prevalences for the three estimated clones and the green solid line corresponds to the normal clone (see Tables S15 and S16 of the Supplementary Information).

