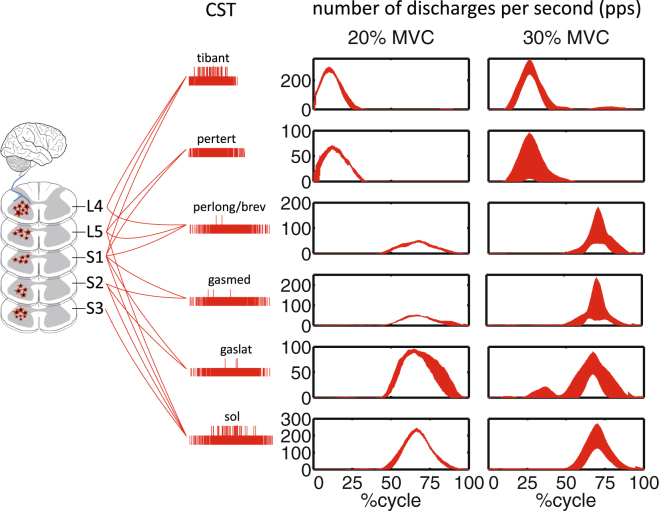
Figure 4.
The neural drive to muscles. Total number of pulses per second (pps) discharged by the population of motor neurons decoded across two levels of percentage maximal voluntary contraction (%MVCs). Discharge profiles are computed from motor neuron cumulative spikes trains (CST, Eq. 1) for all investigated muscles including: tibialis anterior (tibant), peroneus tertius (pertert), peroneus longus and brevis (perlong), soleus (sol), gastrocnemius lateralis (gaslat) and gastrocnemius medialis (gasmed). The 0% denotes the onset of the dorsi-flexing phase while the 100% denotes the completion of the plantar-flexing phase of the task. Data are reported for the ankle anatomical angular position. Within each graph values are averaged across all validation trials and subjects, with depicted profiles reflecting the first standard deviation band.

