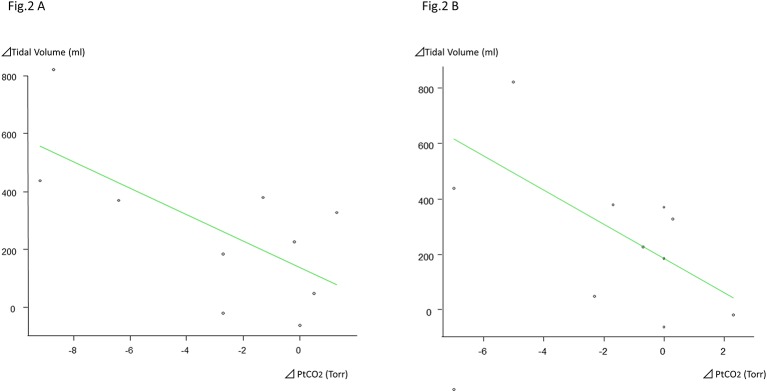
Figure 2.
The amount of change in the NHF-OTS HFNC 30 L/min tidal volume and Δ PtCO2. At HFNC 30 L/min, the difference between the increment in vital capacity and the Δ PtCO2 shows a tendency for a weak negative correlation, with a correlation coefficient of –0.461, but it is not significant (p=0.18). The amount of change in the NHF-OTS HFNC 50 L/min tidal volume and Δ PtCO2. At HFNC 50 L/min, the increment in the vital capacity and the difference in the Δ PtCO2 show a correlation coefficient of –0.652, with a 95% CI of –0.909 to –0.0376, and p=0.0412. HFNC, high-flow nasal cannula; PtcCO2, transcutaneous carbon dioxide.

