
Figure 2.
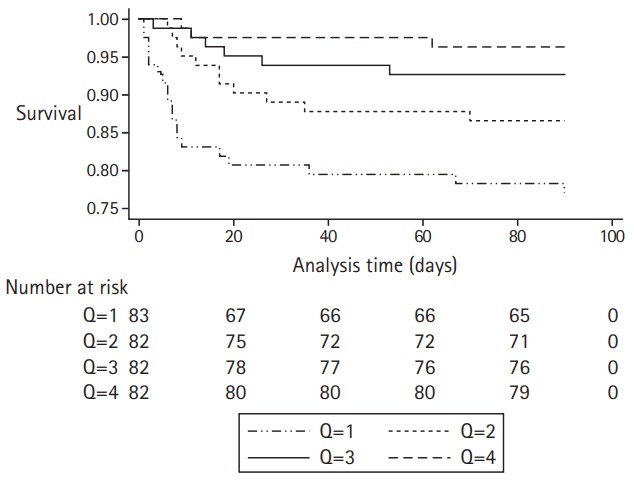
Kaplan-Meier survival estimates for patients stratified by log-miR-150-5p quartiles. The numbers of patients at risk are indicated at multiples of 20 days. Overall, Kaplan–Meier survival curves of patients stratified per log-miR-150-5p quartiles differed (P<0.001, log-rank test). Q means quartiles of log10-transformed values of miR-150-5p were used in these analyses. The x-axis is abridged and shows only the results of the 90 days after event.