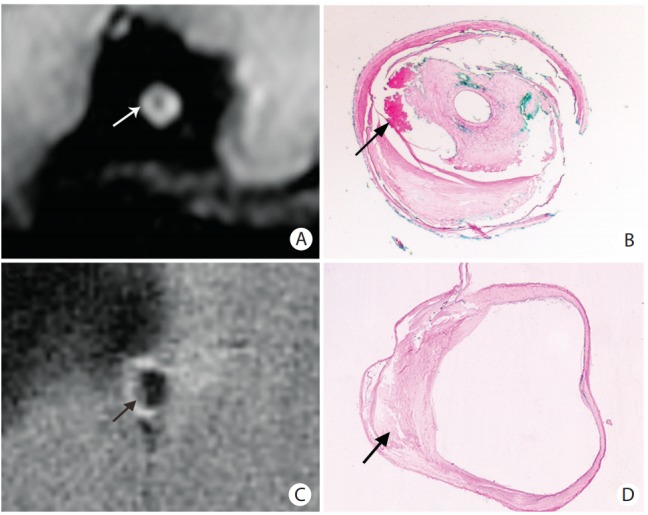
Figure 4.

Representative magnetic resonance (MR) images and the corresponding histology slides. (A, B) The hyper-intense on MR images (arrow in A) was verified to be intraplaque hemorrhage (arrow in B). (C, D) The hypo-intense on MR images (arrow in C) was verified to be lipid accumulation (arrow in D). The histological slides were stained with hematoxylin-eosin staining. Original magnification: ×1.6.
