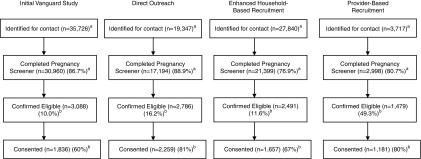
Fig. 1.
Flow diagram of samples by type of recruitment. aSource: National Children’s Study [18]. bSample for this study. IVC Participant Recruitment Dataset V2.1, IVC Enrolled Women Analysis File V2.1, IVC Recruitment Analysis File V2.1, and ARS Analysis File V3.1.

