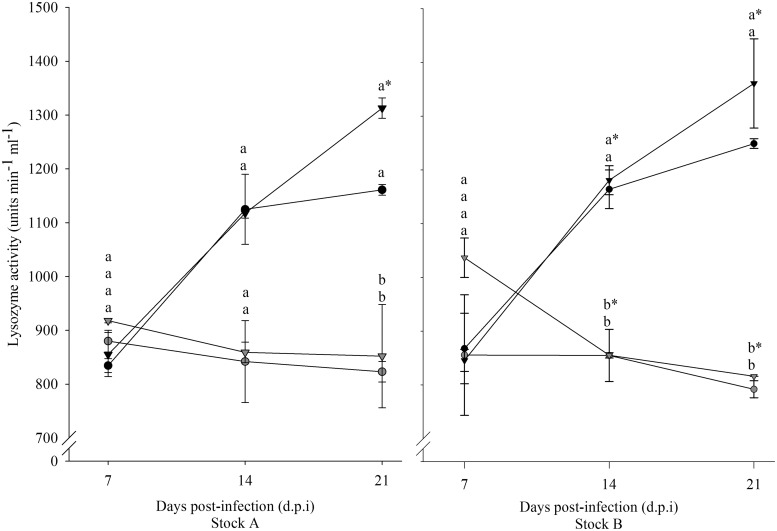
Fig. 6.
Lysozyme activity (unit min−1 mL−1) over time in infected (triangle) and uninfected (circle), diploid (black) and triploid (grey) Atlantic salmon from Stocks A and B. Statistically significant differences between groups at each time point are indicated by different lowercase letters. Significant time differences relative to 7 dpi are indicated by asterisk (*).

