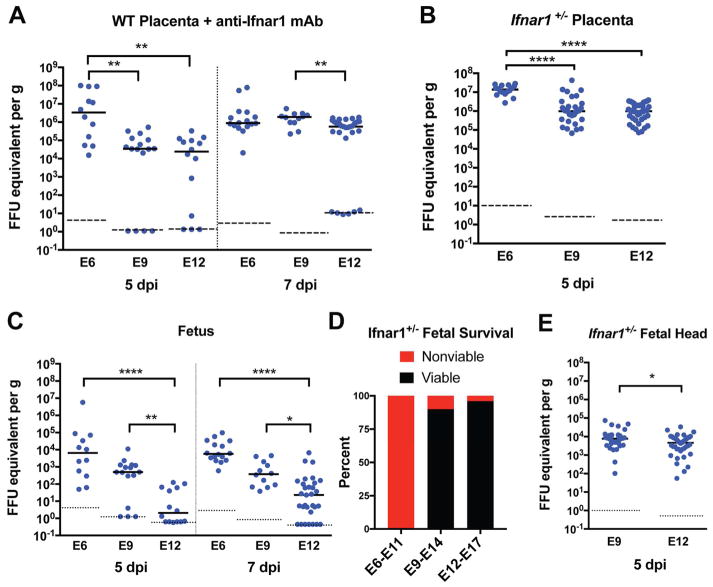
Figure 1. Timecourse of Placental and Fetal Susceptibility to ZIKV infection.
A, C. WT C57BL/6J pregnant dams were treated with 2 mg of anti-Ifnar1-blocking antibody (MAR1-5A3) on the day prior to infection and then subcutaneously inoculated on E6, E9, or E12 with 103 FFU of ZIKV-Brazil. ZIKV replication in placenta and whole fetuses (E6, 5 days post-infection (dpi)) or fetal heads (all other timepoints) was quantified by RT-qPCR 5 or 7 days after infection. B, E. Ifnar1−/− dams were mated with WT sires and inoculated with ZIKV-Brazil on E6, E9, or E12. Tissues were harvested 5 dpi for viral quantification by RT-qPCR. P values in A–C were calculated by Kruskal-Wallis test with Dunn’s multiple comparisons test: *, P < 0.05; **, P > 0.01; ***, P > 0.001; ****, P < 0.0001. Statistical significance in E was determined by an unpaired two-tailed Student’s t-test: *, P < 0.05. Dots indicate data from individual fetuses or placentas, and bars and dashed lines indicate median values and limits of detection, respectively. D. Ifnar1+/− fetal viability at the time of harvest was assessed 5 dpi at the timepoints shown (0% for E6–E11, 90% for E9–E14, and 96% for E12–E17, P < 0.0001 by the Chi-Square test; n = 44 fetuses for E6–E11; n = 70 for E9–E14; and n = 68 for E12–E17). Data in this figure is pooled from at least three independent experiments. See also Figure S1.

