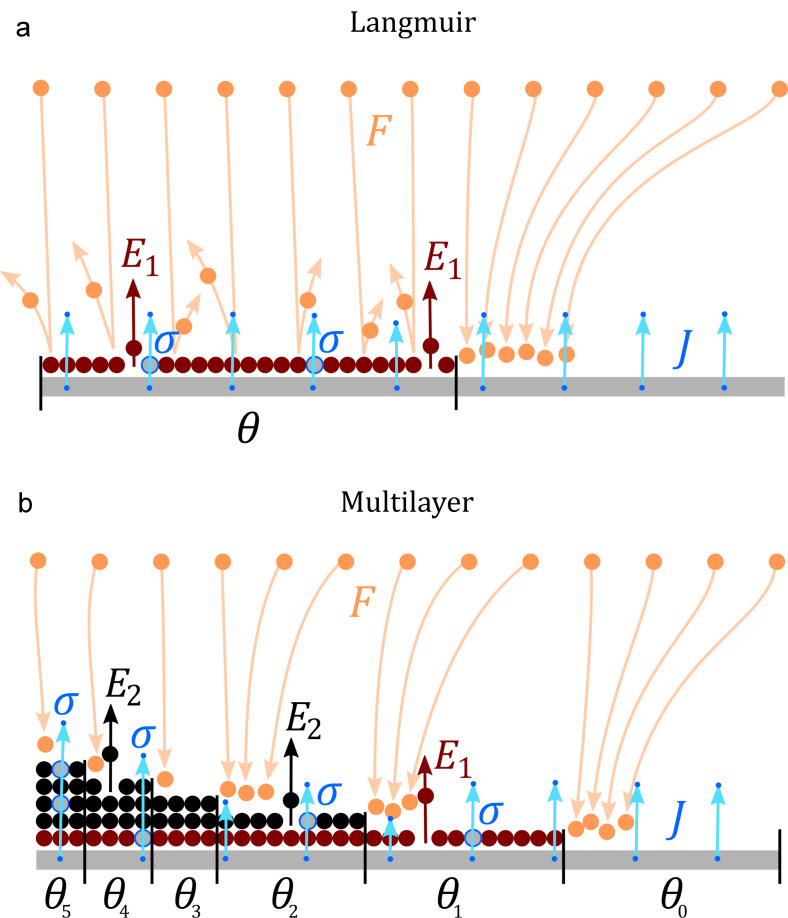
Figure 1.
Schematic representation of the FEBID (a) Langmuir and (b) ML model. No diffusion is considered. Incoming precursor molecules with flux F are represented by orange spheres and arrows. Molecules adsorbed with energy E1 (for Langmuir and first monolayer in ML model) are represented with red spheres, and upper monolayers (ML model) adsorbed with energy E2 with black spheres. Electrons responsible for dissociation (here only represented as secondary electrons emitted from the substrate), with current density J and dissociation probability σ, are represented by blue dots and arrows. Molecules dissociated by electrons are shown as grey spheres. Only one monolayer is permitted in the Langmuir model, with fractional coverage θ. Multiple layers are possible in the ML model, where the fraction of empty sites is θ0, and fraction of occupied sites with one, two, three, etc. adsorbed monolayers, is θ1, θ2, θ3, etc..

