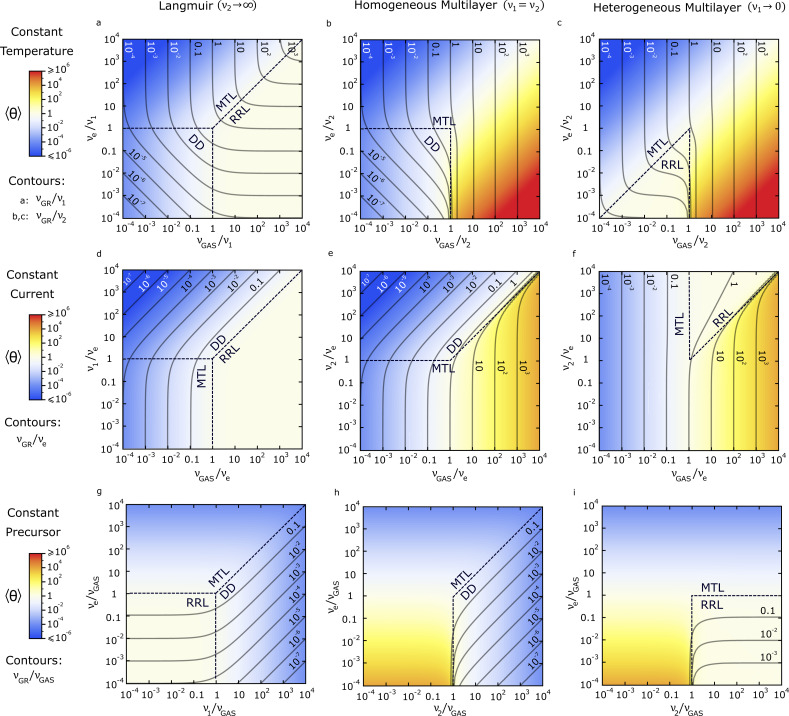
Figure 3.
FEBID maps representing growth rate (contours) and adsorbate concentration (colours) for steady state conditions, as a function of the characteristic frequencies ruling a FEBID process. Different growth regimes are indicated for each region. Maps for constant temperature (a–c), current (d–f) and precursor flux (g–i) conditions are given. The Langmuir model (a, d, g), and the ML model with homogeneous adsorption (b, e, h) and heterogeneous adsorption (c, f, i) are compared.

