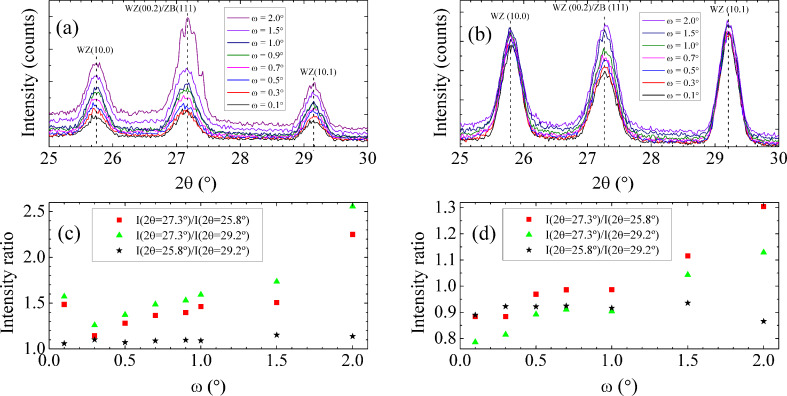
Figure 3.
(a), (b) Grazing incidence X-ray diffraction diffractograms (ω/2θ) measured for samples A and B, respectively, obtained with different ω incidence angles. (c), (d) Ratios of the relative intensity of the peaks at 2θ = 25.8, 27.3 and 29.2° as a function of ω for samples A and B, respectively.

