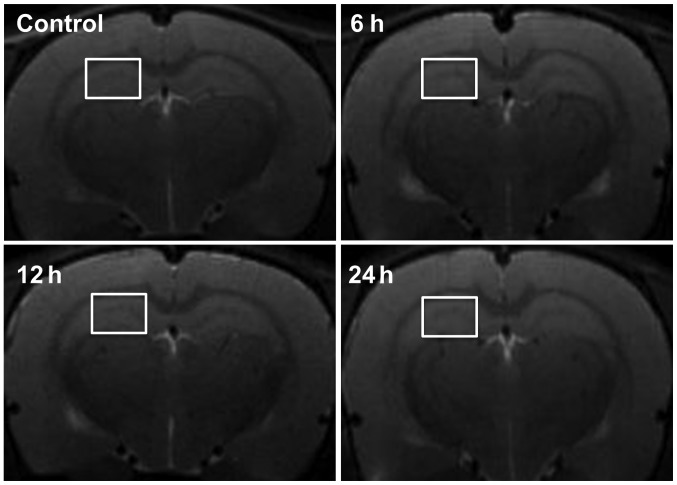
Figure 4.
Representative T2WI MRI of the control and LPS-injected groups at the selected time-points. The results showed no significant changes at any of the time-points. White squares on the right hippocampus indicate regions of interest selected for MRS analysis. T2WI, T2-weighted imaging; MRI, magnetic resonance imaging; LPS, lipopolysaccharide; MRS, magnetic resonance spectroscopy.

