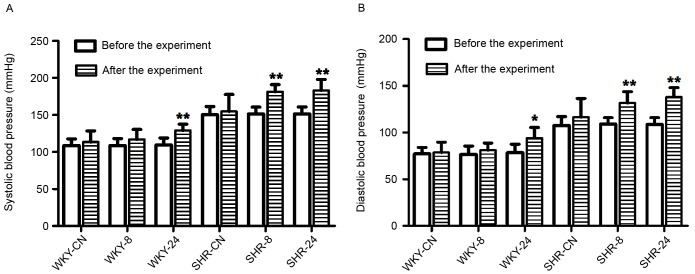
Figure 2.
Effect of a hot and humid environment on (A) systolic and (B) diastolic blood pressure. Data are presented as the mean ± standard deviation (n=8). *P<0.05 and **P<0.01 vs. before the experiment. WKY, Wistar-Kyoto rats; SHR, spontaneously hypertensive rats; CN, control; −8, heat exposure for 8 h; −24, heat exposure for 24 h.

