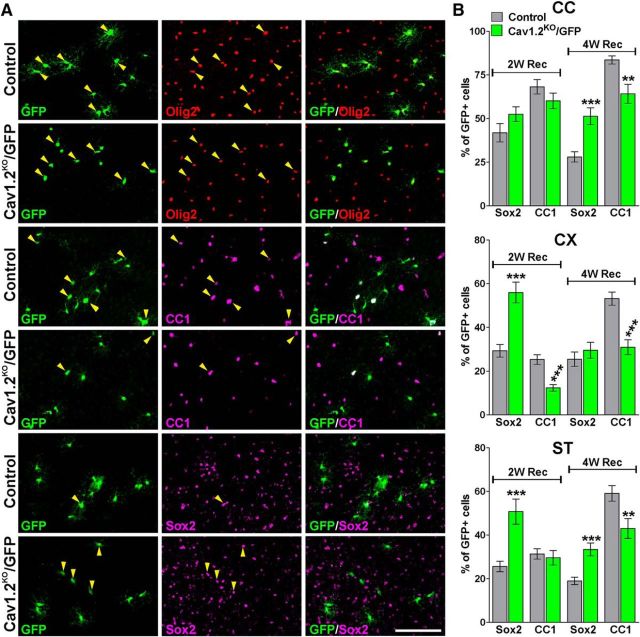
Figure 9.
Decreased maturation of Cav1.2KO/GFP OPCs in the remyelinating brain. A, Representative coronal sections of the cingulate cortex from control and Cav1.2KO/GFP mice immunostained for Olig2, CC1, and Sox2 at 2 weeks of recovery. Scale bar, 90 μm. B, Percentage of GFP/Sox2 and GFP/CC1 double-positive cells was stereologically quantified in the center of the corpus callosum (CC), cingulate cortex (CX), and striatum (ST) at 2 and 4 weeks of recovery. Comparisons between experimental groups were made by the unpaired t test. Data represent pooled results from at least six brains per experimental group and values are expressed as mean ± SEM. **p < 0.01, ***p < 0.001 versus control.

