Figure 6.
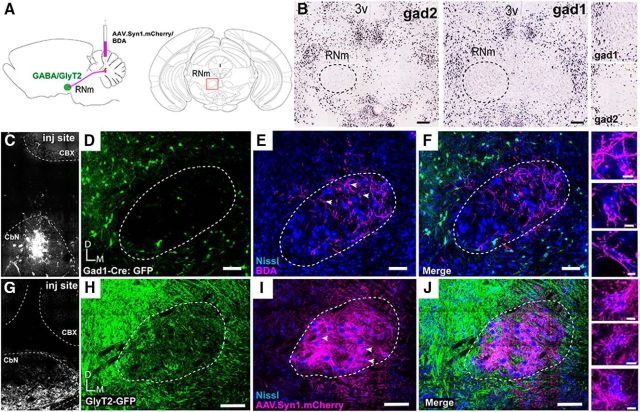
IN terminal fields in RNm do not overlap with inhibitory somata. A, Schematic of experimental setup. AAV1.mCherry or BDA 10K was injected into the IN of either Gad1-Cre or GlyT2.eGFP mice. B, In situ hybridization showing Gad1 and Gad2 mRNA expression at the level of RNm from the Allen Brain Atlas (Lein et al., 2007; http://mouse.brain-map.org). Note absence of label within putative RNm. Scale bars, 200 μm. Right, Zoom of RNm border. C, Injection site of BDA into the Cbn of a Gad1.Cre animal, dashed line delineating CbN. D, GFP-expressing cells at the level of RNm (dashed line) driven by Gad1.Cre. E, BDA-labeled IN terminals in RNm, delineated with Nissl counterstain. F, Merged channels from C and D showing IN terminals in area devoid of somatic Gad1-GFP label (n = 5). Scale bar, 100 μm. G, Injection site of AAV.mCherry into the CbN, dashed line. H, GFP-expression in GlyT2-GFP mouse at the level of RNm (dashed line). I, mCherry labeled IN terminals target RNm, delineated with Nissl counterstain (right). J, Merged channels from H and I showing IN terminals in RNm do not overlap with GlyT2-GFP somata (n = 3). Scale bar, 100 μm. Right, IN terminals wrap around RNm somata counterstained with Nissl. Scale bar, 10 μm. CbN, Cerebellar nuclei; D, dorsal; M, medial; CBX, cerebellar cortex.

