Figure 2.

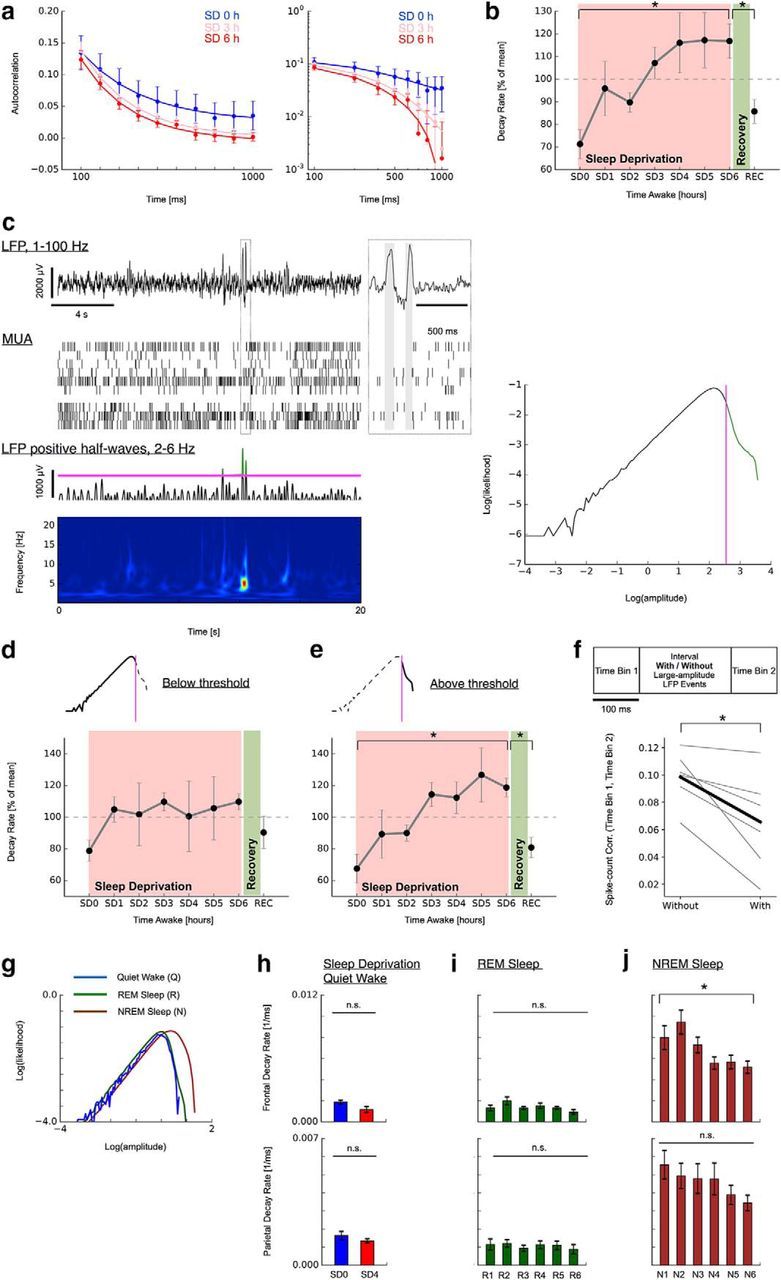
Two-state dynamics underlies the decline in long-range temporal correlations during sleep deprivation. a, Decay in spike count autocorrelation (AC) accelerates as a function of time awake and recovers after sleep (MUA; Q; SD0–SD6 followed by REC). Mean AC over all multiunits (n = 26; 1 rat; SEM). Solid lines indicate exponential fit. Left, Linear plot. Right, Double-logarithmic plot. SD3 line has been shifted slightly upward for visibility. b, Summary of decline in decay rates and recovery for all n = 6 animals (SEM). c, Identification of two-state dynamics underlying decay in long-range temporal correlations with sleep deprivation. Large-amplitude LFP events are observed intermittently and typically coincide with pauses in MUA (top; offline periods marked as gray areas in magnified inset). These LFP events typically present as one or more positive half-waves predominantly in the frequency range 2–6 Hz (bottom, wavelet spectrogram and positive LFP trace band-pass filtered between 2 and 6 Hz). Right, Bimodality in the histogram of positive 2–6 Hz waves. The bimodality was used to separate the large-amplitude LFPs containing putative offline periods from other activity for each rat individually (magenta line). d, e, Decline in long-range temporal correlations is restricted to data segments containing large-amplitude LFP events. Data depicted in a–d are from dataset 1. f, Intermittent large-amplitude LFP events decrease spike count autocorrelation (gray: individual animals; black: mean across animals). g, Histogram of positive LFP 2–6 Hz waves sorted by vigilance states (dataset 2; top row, frontal; bottom row, parietal). h, Autocorrelation decays remains unchanged (right) in data without large-amplitude LFP events during sleep deprivation (Q, SD0, SD4). i, Autocorrelation decay rates during REM sleep remain unchanged (dataset 2; 6 h recovery sleep; R1–R6). j, Autocorrelation decay rates in NREM sleep decrease over the 6 h recovery sleep (dataset 2; N1–N6). ★ indicates a significance value p < 0.05.
