
Figure 1.
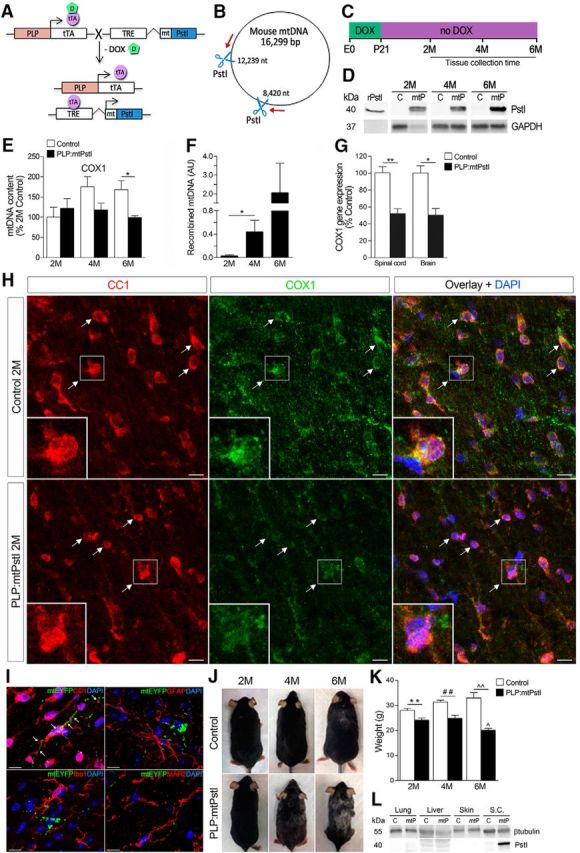
Generation and characterization of PLP:mtPstI mice. A, Schematic of the generation of PLP:mtPstI mice. PLP-tTA mice expressing the tTA under the control of the PLP promoter were crossed with mice expressing a mtPstI downstream of a TRE. In the absence of DOX (−DOX) tTA binds to TRE, initiating PstI transcription (tet-off system). B, Diagram of mouse circular mtDNA with PstI restriction sites (8420 and 12,239 nt, blue scissors) and primers (red arrows) for the amplification of recombined mtDNA fragments generated following PstI cleavage. C, Experimental timeline: mice received DOX until P21 and were sacrificed at 2, 4, or 6 months of age. D, PstI protein expression in the spinal cords of 2-, 4-, and 6-month-old PLP:mtPstI (mtP) and control (c) mice; recombinant PstI was included as positive control. E, Real-time PCR quantification of COX1 in the spinal cord of 2-, 4-, and 6-month-old mice as a measure of mtDNA depletion. Results are normalized to genomic β-actin and are expressed as percentage of 2-month-old controls; n = 3–7/group; *t(4) = 3.031, p = 0.0387, t test. F, Real-time PCR quantification of recombined mtDNA in PLP:mtPstI mice as a measure of mtDNA deletions; n = 4–5/group; *t(7) = 2.407, p = 0.047, t test. AU, Arbitrary units. G, Real-time PCR quantification of COX1 gene expression in oligodendrocytes from spinal cords and brains of 4-month-old control and PLP:mtPstI mice; n = 3–4/group; *t(4) = 4.259, p = 0.0131, t test; **t(6) = 5.131, p = 0.0022, t test. H, Confocal images of the spinal cord white matter of 2M control and PLP:mtPstI mice colabeled with CC1 and mitochondrial COX1; white arrows show localization of COX1 in CC1+ mature oligodendrocytes. Scale bars, 10 μm. I, Representative confocal images from the thoracic spinal cords of 2-month-old PLP:mitoEYFP mice after 5 weeks of reporter induction (EYFP). Sections were colabeled for CC1, GFAP, Iba1 and MAP2. Scale bar, 10 μm. J, Progressive phenotypic changes in PLP:mtPstI mice induced at P21 compared with control mice. K, Assessment of body weight in PLP:mtPstI mice induced at P21 and in control mice; **t(10) = 3.319, n = 5–7, p = 0.0078, t test; ##t(5) = 4.145, n = 3–4, p = 0.009, t test; ∧∧t(10) = 4.134, n = 4–8, p = 0.002, t test; ∧F(2,10) = 7.586, p = 0.0099, ANOVA, Bonferroni's multiple-comparison test: 2- vs 6-month-old PLP:mtPstI mice, t = 3.188, p < 0.05; and 4- vs 6-month-old PLP:mtPstI mice, t = 3.582, p < 0.05. L, Representative Western blot of PstI expression in non-neural tissues. M, Month.