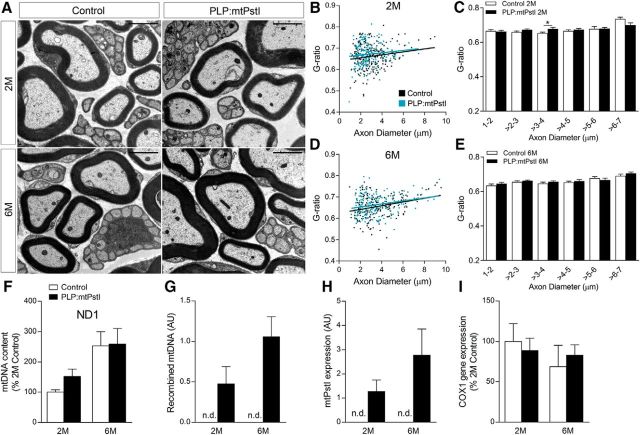
Figure 5.
mtPstI expression in the peripheral nervous system does not affect peripheral myelination. A, Representative electron micrographs of the sciatic nerve of 2- and 6-month-old control and PLP:mtPstI mice. Scale bars, 2 μm. B, D, Assessment of the g-ratio at 2 (B) and 6 (D) months; values were plotted vs the corresponding axon diameter. Data were fitted to a linear regression, and the slopes were not significantly different between genotypes. Slopes: 2-month-old controls (0.0070 ± 0.0029, r2 = 0.026) vs 2-month-old PLP:mtPstI mice (0.0055 ± 0.0029, r2 = 0.0160); 6-month-old controls (0.0087 ± 0.0021, r2 = 0.074) vs 6-month-old PLP:mtPstI mice (0.0070 ± 0.0018, r2 = 0.0684). C, E, G-ratio of myelinated fibers at 2 (C) and 6 (E) months grouped by increasing axon diameter. *t(90) = 2.317, p = 0.023, t test. F, Real-time PCR quantification of ND1 in the sciatic nerve of 2- and 6-month-old mice as a measure of mtDNA depletion. Results are normalized to genomic β-actin and expressed as the percentage of 2-month-old controls. G, Real-time PCR quantification of recombined mtDNA in the sciatic nerve as measure of mtDNA deletions. H, Real-time RT-PCR quantification of mtPstI gene expression in the sciatic nerve. I, Real time RT-PCR quantification of COX1 gene expression in the sciatic nerve. AU, Arbitrary units; M, month; n.d., nondetectable.

