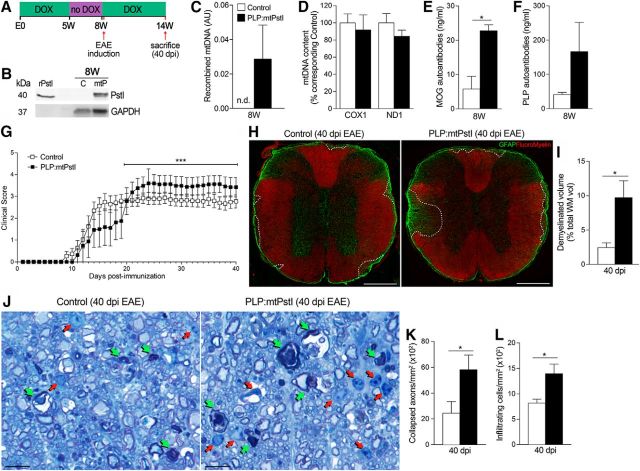
Figure 6.
Brief transient induction of mtDNA DSBs in oligodendrocytes leads to the production of myelin autoantibodies and a biphasic EAE response. A, Experimental setup: DOX was withdrawn for 3 weeks, from week 5 to week 8, and resumed 2 d before EAE induction. All mice, both transgenics and controls, were subjected to the same regimen. Controls were littermates of PLP:mtPstI mice, constituting a mix of WT, PLP-tTA, and mtPstI mice. B, Western blot assessment of PstI protein expression in the spinal cord at 8 weeks, immediately after 3 weeks of DOX withdrawal. C, Control mice; mtP, PLP:mtPstI mice. Recombinant PstI was included as a positive control. C, Real-time PCR quantification of recombined mtDNA in PLP:mtPstI mice as a measure of mtDNA deletion. n = 3/group. D, Real-time PCR quantification of the mitochondrial-specific genes COX1 and ND1 in the spinal cords of PLP:mtPstI and control mice at 8 weeks as a measure of mtDNA depletion. Results are normalized to genomic β-actin and expressed as a percentage of the corresponding control; n = 3/group. E, F, ELISA detection of anti-MOG (E; *t(4) = 4.183, n = 3, p = 0.0139, t test) and anti-PLP (F) antibodies in the serum of PLP:mtPstI and control mice at 8 weeks. G, Clinical course of MOG35–55-induced EAE. Results are expressed as daily mean scores ± SEM of 8–12 mice from 3 independent experiments. The subacute to chronic phase of the disease (20–40 dpi, starting from peak disease) in PLP:mtPstI mice is significantly different from that in controls; ***p < 0.001, Mann–Whitney test. H, Representative confocal images of the thoracic spinal cord labeled with anti-GFAP (green) and FluroMyelin (red). Scale bars, 400 μm. I, Stereological estimation of the demyelinated white matter volume based on FluroMyelin staining. Results are expressed as a percentage of total white matter; *t(7) = 3.168, n = 4–5, p = 0.0157, t test. J, Toluidine blue staining of semithin thoracic spinal cord sections. Green arrows, collapsed axons; red arrows, infiltrating immune cells. Scale bars, 5 μm. K, L, Stereological estimation of collapsed axons (K; *t(7) = 2.362, n = 4–5, p = 0.0502, t test) and infiltrating cells (L; *t(7) = 3.105, n = 4–5, p = 0.0172, t test) in the spinal cord white matter. AU, Arbitrary units; n.d., nondetectable; W, week; dpi, days post induction; WM, white matter.

