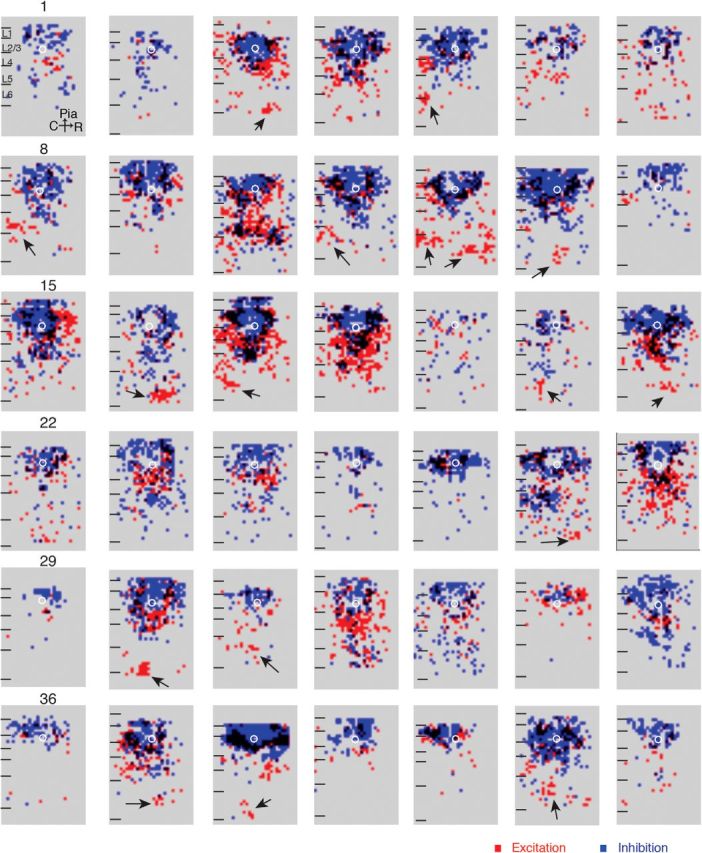
Figure 2.

L2/3 cells show diverse connections. Overlays of excitatory (red) and inhibitory (blue) maps for 42 cells. Locations where excitation and inhibition overlap are shown in black. The soma locations of the patched cells are indicated by the white circles.
