Figure 9.
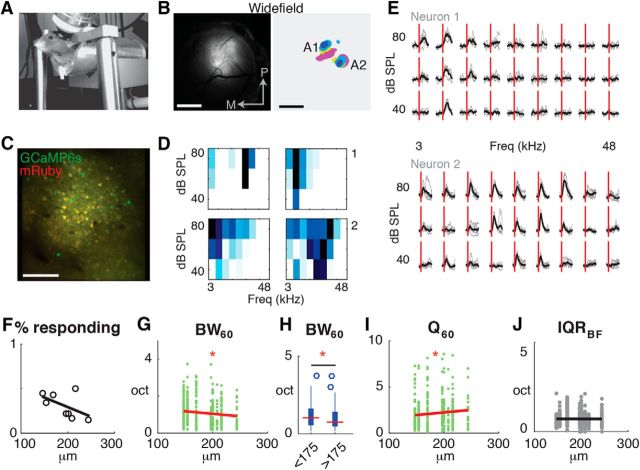
Imaging of sound evoked activity in L2/3 neurons of auditory cortex in awake mice reveals sublaminar differences in frequency integration. A, Image of awake mouse under two-photon microscope. B, Left, Wide-field epifluorescence image of cranial view showing expression of GCaMP6. Scale Bar, 1 mm. Right, Composite frequency map of sound-evoked activation areas for midlevel sound intensity (60 dB SPL). Tonotopic and non-tonotopic gradients indicate location of A1 and A2, respectively. C, Full resolution field-of-view captured with two-photon imaging showing cellular expression of AAV-mRuby2-GCamp6s in A1. Scale bar, 100 μm. D, Overview of frequency response areas for four responsive neurons in a single field-of-view. E, Evoked intracellular calcium responses for two pyramidal neurons in A1 to 9 different frequencies (column) and three sound levels (row). Each gray line indicates the response of the neurons to a single sound presentation; black line indicates the average across stimulus presentations. Five repeats per condition. Red vertical line indicates sound onset. F, Scatterplot showing percentage of responding neurons as a function of L2/3 depth (n = 8 FOV). Black line shows linear regression. p = 0.188. G, Scatterplot showing BW60 as a function of imaging plane depth (n = 576 neurons). Red line shows linear regression. p = 0.016. H, Boxplot showing BW60 for L2 and L3 neurons. p = 0.016, ANOVA. I, Scatterplot showing Q60 factor as a function of cortical depth (n = 576 neurons). Red line shows linear regression. p = 0.04. J, Scatterplot showing IQRBF100 as a function of depth (n = 576 neurons). Black line shows linear regression. p > 0.05. Triple asterisk indicates a higher significance level.

