
Figure 1.
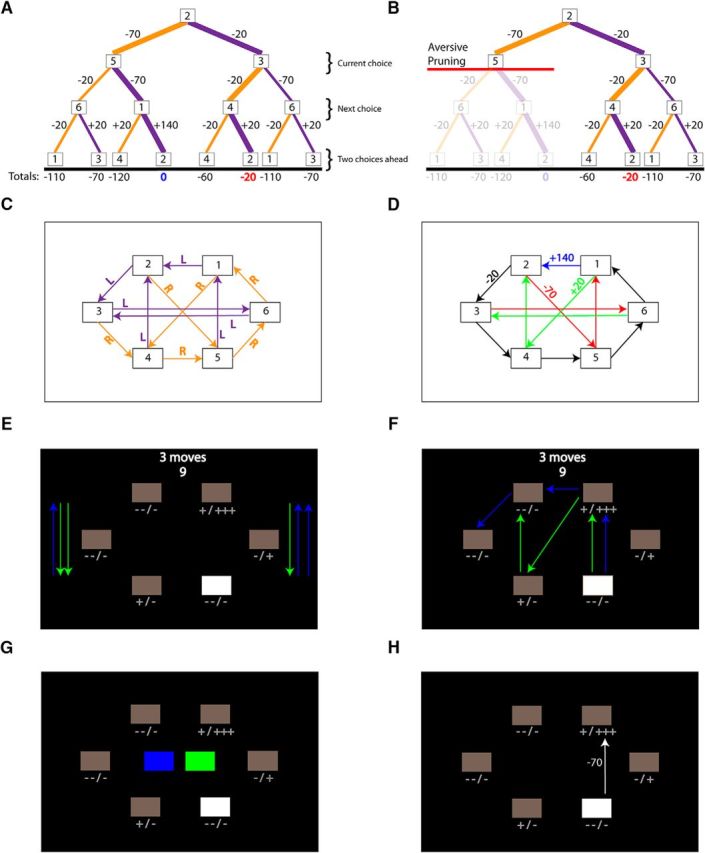
Aversive pruning example and fMRI task design. A, Decision tree and monetary outcomes up to a depth of three from starting state 2. Purple- and orange-colored lines indicate pressing the left and right buttons, respectively. The totals earned for the two best paths (thicker lines; breaking even and losing 20 pence) are shown in blue and red. B, An example of disadvantageous aversive pruning. The red line shows the curtailment of the search within the decision tree upon encountering a large monetary loss (−70 pence), such that the more advantageous break-even sequence is not considered. C, Button presses and transitions within the maze. D, Monetary outcomes within the maze. E, Free plan trial. Beginning in a selected white box, participants had 9 s to plan a sequence of moves (3–5 moves, indicated at the top of the screen) to maximize income. Plusses and minuses below each box indicate the potential outcomes possible from moving from there but are not indicative of directionality. Colored sidebar arrows were included to match visual input with restricted plan trials. F, Restricted plan trial. Participants had 9 s to decide between two maze routes (green and blue), one of which provided higher net income. G, For restricted plan trials, the selection of either the blue or green route involved choosing either the left or right button. H, After entering their moves or path selection, participants were shown their selected path with the corresponding monetary outcome for each box-to-box transition for both free and restricted plan trials. Summed path totals were not shown.