
Figure 12.
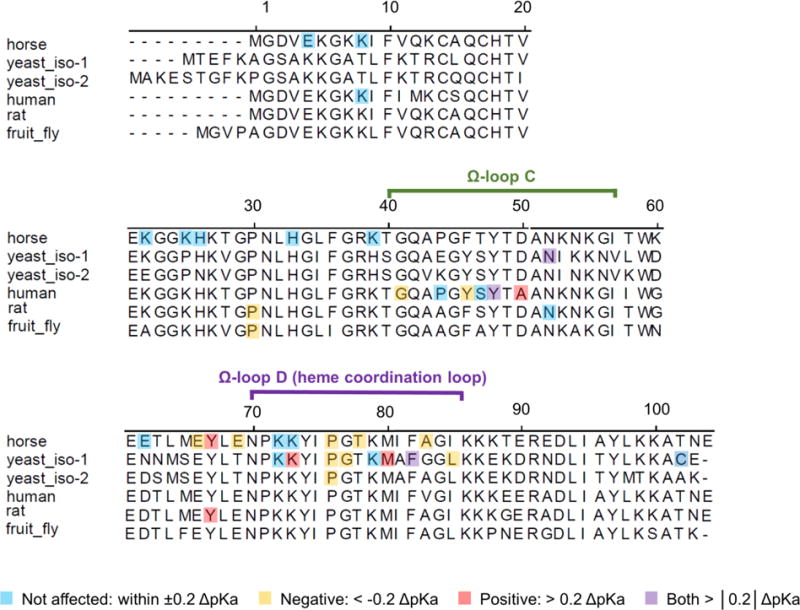
Sequence alignment of cyt c from various species, for which information about mutational effects on the pKa value for the alkaline transition is available. Highlighted are mutation sites, color-coded by the magnitude and direction of the change in the pKa value. Table S1 lists the mutants and their pKas.