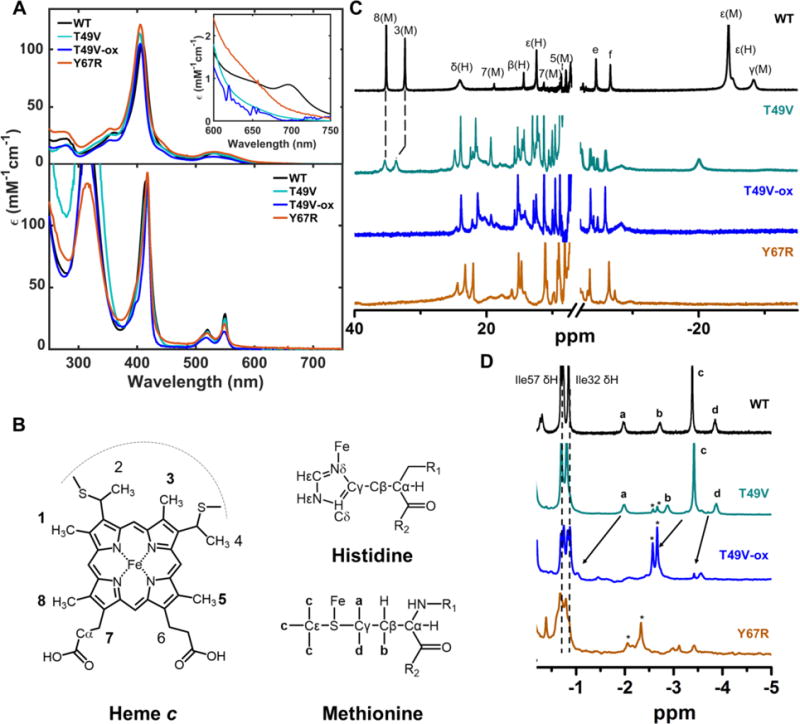
Figure 2.

Spectra of WT (black), T49V (cyan), T49V-MetSO (blue), and Y67R (orange) horse heart cyt c at pH (or pD) 7.4. (A) Absorption spectra of ferric (top) and ferrous (bottom) proteins at 22 ± 2 °C. (B) Structures of heme, His and Met showing the labeling nomenclature. (C) 1H NMR spectra of ferric proteins and (D) 1H NMR spectra of ferrous proteins at 25 °C. Numbered peaks correspond to protons in the heme porphyrin, with the identity of the iron ligand in parenthesis. Other labels correspond to M= Met80 or H= His18, e = Gly29 αH, and f= Pro30 δH. Peaks labeled with asterisk are the proton peaks of Met-SO.
