
Figure 8.
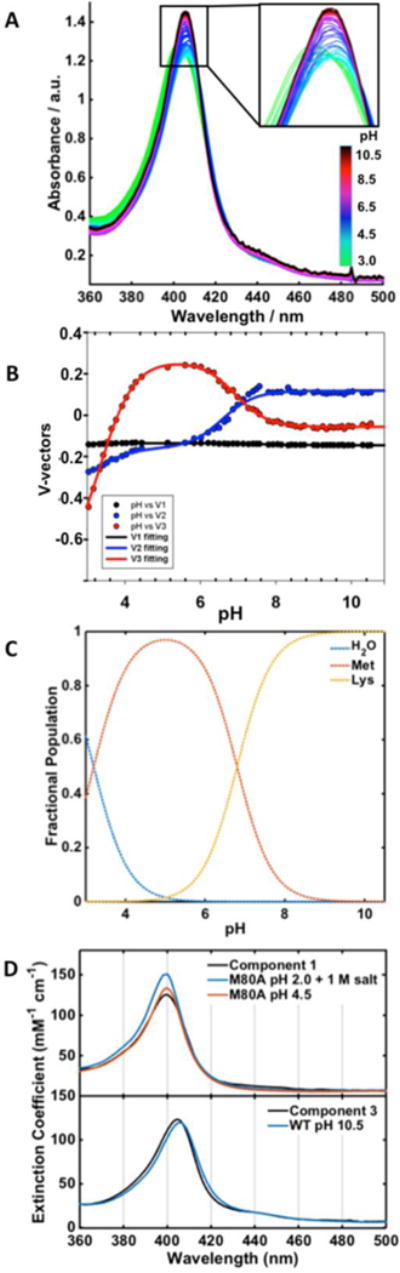
(A) Electronic absorption spectra of T49V over a pH range from 3.0 to 10.5 at 22 ± 2 °C. (B) Plots of the V-vectors from SVD analysis of these spectra. (C) Fractional populations Fi of the three components using pKa1 = 3.3 and pKa2 = 6.8. (D) Spectra of Components 1 and 3 from SVD analysis are compared to that of H2O-ligated M80A pH 2.0 with 1 M salt and at pH 4.5 (top) and Lys-ligated WT at pH 10.5 (bottom). The spectrum of Met-ligated WT at pH 7.4 was used as an input for Component 2.