
Figure 9.
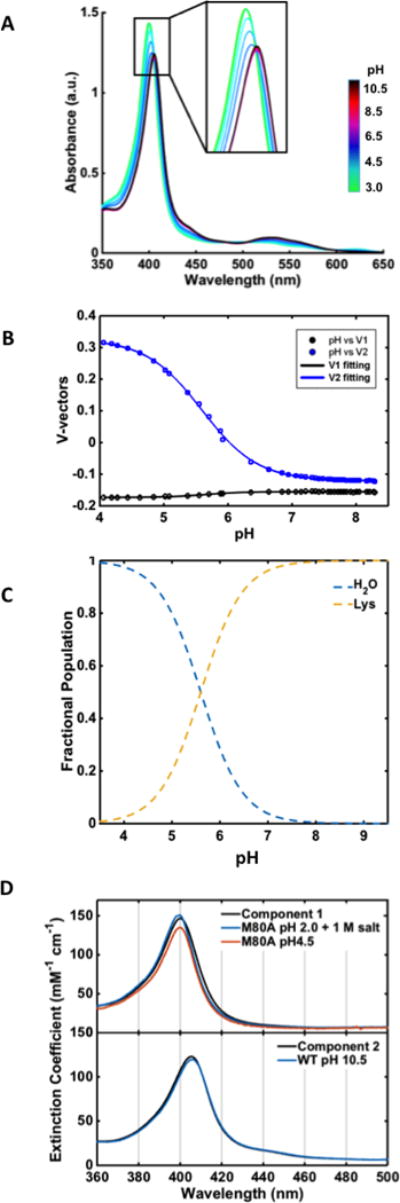
(A) Electronic absorption spectra of Y67R/M80A over a pH range from 4.0 to 8.3 at 22 ± 2 °C. (B) Plots of the V-vectors from SVD analysis of these spectra. (C) Fractional populations Fi of the two components using pKa = 5.6. (D) Spectra of the two components from SVD analysis are compared to that of H2O-ligated M80A at pH 4.5 and at pH 2.0 with 1 M added salt (top) and Lys-ligated WT at pH 10.5 (bottom).