Fig. 3.
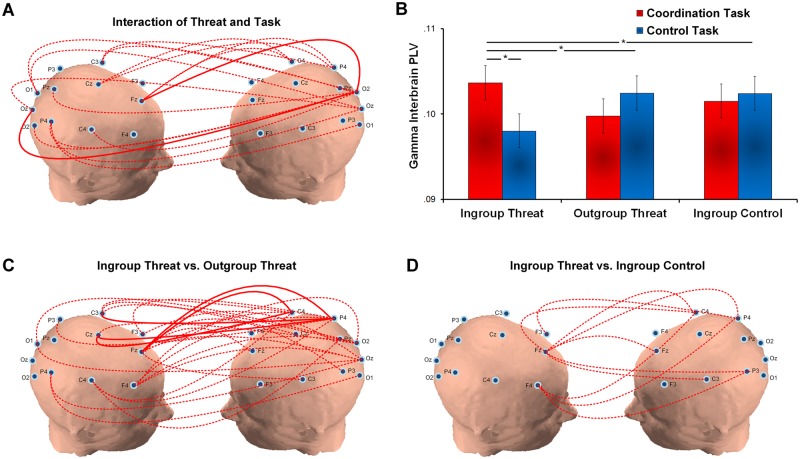
Gamma band interbrain synchrony. (A) The 2 (Task: coordination vs control) × 3 (Threat: ingroup threat (IGT), outgroup threat (OGT) and ingroup no-threat control (IGC)) interaction is significant for widespread regions at 2000–3000 ms. Higher gamma interbrain synchrony of the coordination (vs control) task is observed under the IGT than the other two conditions. (B) The bar chart shows increased gamma interbrain synchrony of the coordination (vs control) task under the IGT and not the OGT and IGC conditions. (C) The 2 (Task: coordination vs control) × 2 (Threat: IGT, OGT) interaction is significant for widespread regions. Gamma interbrain synchrony of the coordination (vs control) task is greater under the IGT than the OGT condition. (D) The 2 (Task: coordination vs control) × 2 (Threat: IGT, IGC) interaction is significant between the frontal and posterior regions. Gamma interbrain synchrony of the coordination (vs control) task is greater under the IGT than the IGC condition (*P < 0.05; **P < 0.01; ***P < 0.001; red dotted line: corrected P < 0.05; red solid line: corrected P < 0.01).

