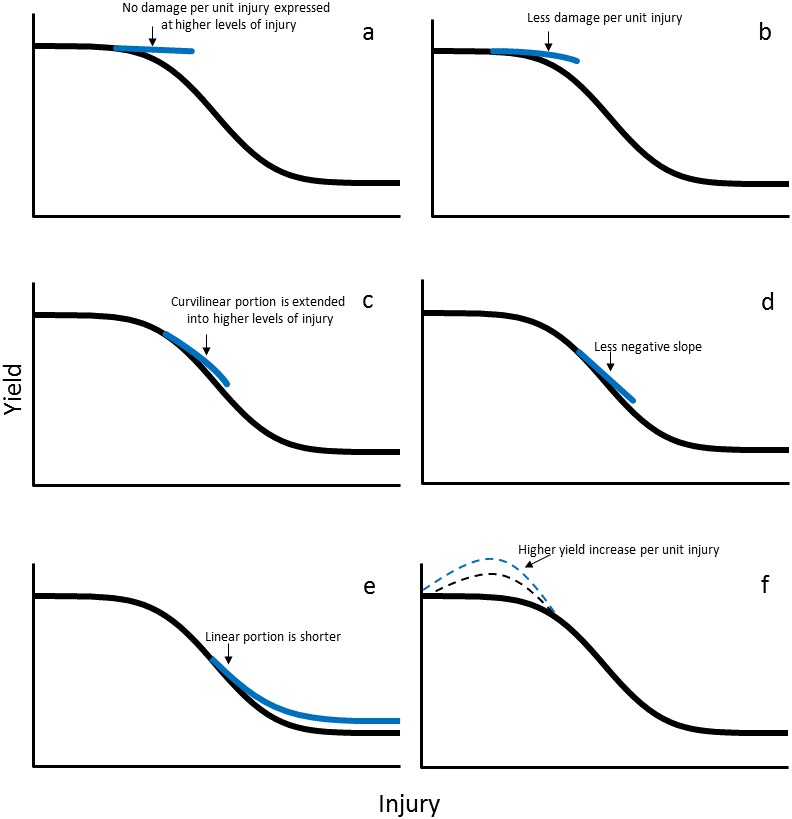
Figure 2. The damage curve showing different portions where tolerance can be expressed.

(A) shows extending the initial zero slope of the damage curve, i.e., no damage per unit injury may be expressed at higher levels of injury for tolerant plants than for nontolerant plants; (B) shows that because this area is curvilinear (with a negative decreasing slope), tolerant plants may express less damage per unit injury; (C) shows that the curvilinear portion may be extended into higher levels of injury; (D) shows that the constant, negative slope (constant damage per unit injury) may have a less negative slope for tolerant plants; (E) shows that the linear portion may be shorter; (D) shows that desensitization and inherent impunity may occur at a higher yield; (F) shows that overcompensation (increasing yield per unit injury), may be expressed by both tolerant plants and nontolerant plants, but tolerant plants may express a higher yield increase per unit injury.
