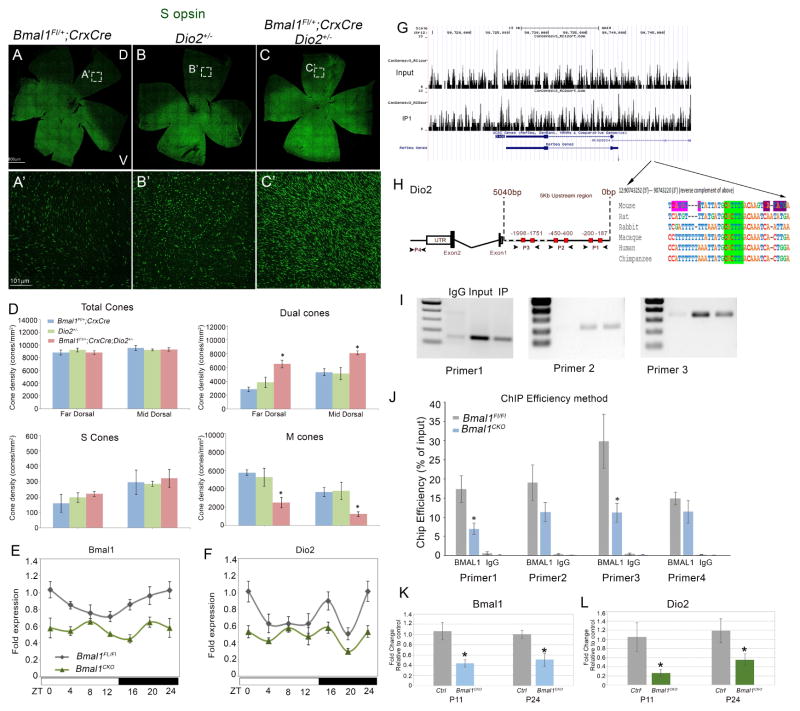
Figure 5. Bmal1 regulates Dio2 expression.
(A–C) retinal flat mount images and (A′–C′) high magnification images from dorsal region of the retina indicating increase in S opsin (green) positive cones in double heterozygous retina (C′) compared to single heterozygous of Bmal1 (A′) and Dio2 (B′).
(D) Quantification of total cones, dual S+M opsins cones, genuine S opsin cones, and genuine M opsin cones in 20x fields across far dorsal (FD) and mid dorsal (MD) regions of the retina. Error bars are ± SEM and n=4–5. Results were analyzed using Student’s t-test. * indicates P<0.05.
(E–F) Circadian oscillations in retinal Bmal1 (E) and Dio2 (F) transcripts from P21 animals of the indicated genotypes. Solid white and black bars on the X-axis indicate light and dark phase, respectively. Bmal1 and Dio2 levels were significantly lower in the Bmal1 CKO group compared to the control group (F1, 47=18.83; P<0.001 and F1, 47=13.50; P<0.001, respectively). Error bars are ± SEM and n=4. Results were analyzed using two-way ANOVA followed by Fisher LSD post-hoc test with genotype and ZT as two independent factors.
(H) Sequence analysis of mouse Dio2 upstream region that contain known E-boxes (red boxes) that bind to BMAL1. P1, P2 and P3 indicate the primer sets designed to amplify the DNA sequence (I) from the Input, BMAl1 IP (Immunoprecipitated) and IgG IP samples. (J) ChIP-qPCR indicating decrease in ChIP efficiency in P24 Bmal1 CKO compared to control. IgG was used a a non specific antibody control for the ChIP experiments. Error bars are ± SEM and n=3. Results were analyzed using Student’s t-test. * indicates P<0.05.
(G) Coverage plots of genomic sequence surrounding Dio2 gene in input and BMAL1 IP retinal samples (P3). Arrows indicate the region in the coverage plot with multiple peaks is a region within the Dio2 promoter [Chr12: 90743252 (5′) --- 90743220 (3′)] that is highly conserved among different species and contains a conserved E box (green highlight). –indicates spaces in alignment. In mouse, the conserved E-box is accompanied by another BMAL1 E-box (CATGTG) (pink) separated by 7 bases and a known CLOCK binding E-box (CATATG) (violet) separated by 6 bases.
(K–L) Relative expression of Bmal1 (K) and Dio2 (L) transcripts in cone-enriched population from control (tdTomato; Bmal1 Fl/+; Hrgp-Cre) and Bmal1 conditional mutant (tdTomato; Bmal1 Fl/Fl; Hrgp-Cre) animals at P11 and P24. Error bars are ± SEM and n=3. Results were analyzed using Student’s t-test. * indicates P<0.05.

